Lab 6: Filters and Resonance
ECE203 - Electrical Circuits II
Electrical and Computer Engineering - University of Alberta
1 Objectives
In this lab session, you will continue to experiment with different series resistor, capacitor and inductor circuits to demonstrate how they can be used as an electrical filter. An electrical filter is a device that passes or accepts a certain range of frequencies and rejects or stops other frequencies. In this lab you will experiment with the following 4 circuits on a breadboard using the Analog Discovery 2 to create and test the following filter circuits.
- High-pass Resistor-capacitor (RC) filter
- Low-pass RC filter
- Low-pass Resistor-inductor (RL) filter
- Band-pass Resistor-inductor-capacitor (RLC) filter
1.1 Equipment Required
- The Lab 6 - Results sheet to record your measurements.
- A Computer with Waveforms installed
- Analog Discovery 2
- Breadboard Breakout for the Analog Discovery 2 with a ribbon cable
- USB A to Micro-B cable
- Digital multimeter
- MB102 breadboard
- Jumper wires
- 470Ω resistor
- 100nF capacitor
- 10mH inductor
2 Procedures
Setup the Analog Discovery 2 as done in the previous lab.
Connect the USB cable from the Analog Discovery 2 your computer.
Use the ribbon cable and 15x2 header pins to connect the Analog Discovery 2 to your Breadboard Breakout . Make sure that the orange wires of the ribbon cable end up on the same side as the breadboard breakout pin labeled 1+.
Plug the breadboard breakout into the breadboard.
Launch the Waveforms software making sure that it detects your Analog Discovery 2.
2.1 Low-pass RC Filter
Passive low-pass Filters
A low pass filter is one that allows low frequency signals to pass through without changing them, but attenuates high frequency signals.
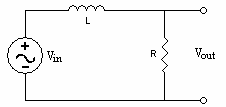
Figure 2.1: A RL Low Pass Filter
Looking at the output of this circuit in terms of generalized impedances: \[V_{out}=\frac{R}{R+j\omega L}\times V_{in}\] It can be seen that if \(\omega\) is very small, the output signal will be almost exactly the input signal. However, as \(\omega\) increases, the fraction becomes small, and the input signal is attenuated.
A low pass filter can also be achieved by taking the output voltage across a capacitor in a series resistor-capacitor circuit:
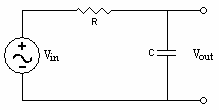
Figure 2.2: A RC Low Pass Filter
Connect the circuit below using the following:
- Connect a 470Ω resistor in series with a 100nF capacitor using the channel 1 (W1) Wavegen outputs from the Analog Discover 2.
- Use the Channel 1 (C1) inputs (1+, 1-) on the Analog Discovery 2 to measure the input voltage (V1) which is also the output voltage from the Wavegen.
- Use the Channel 2 (C2) inputs (2+, 2-) to measure the output voltage which is also the voltage across the capacitor.

Figure 1. Low-pass RC Filter Circuit
Click here to see a simulation demo of this circuit.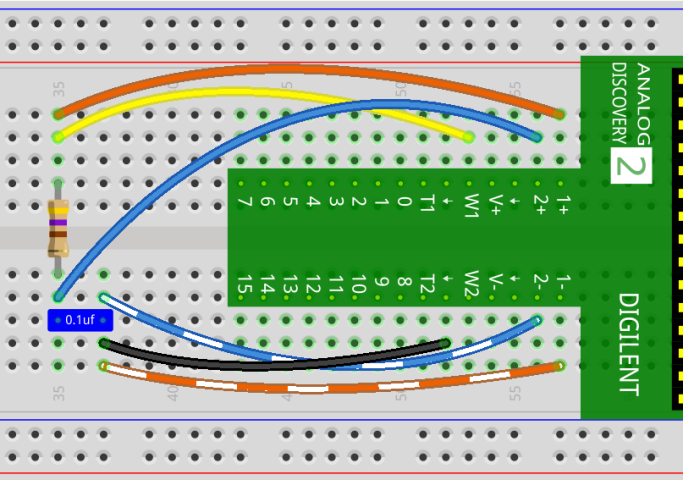
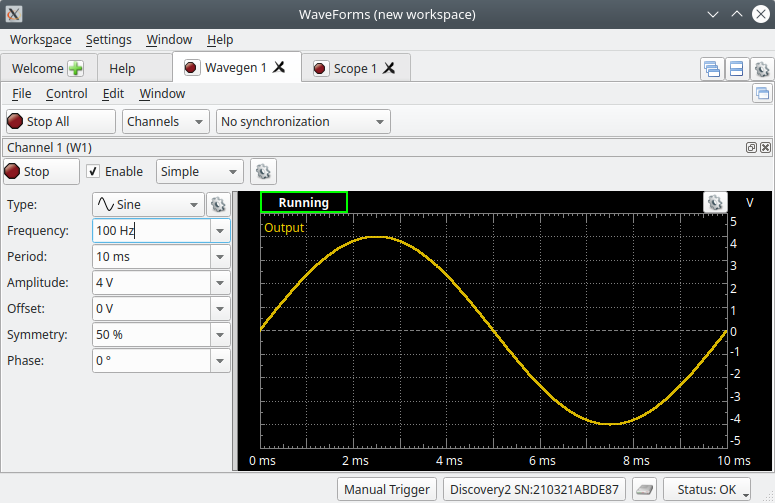
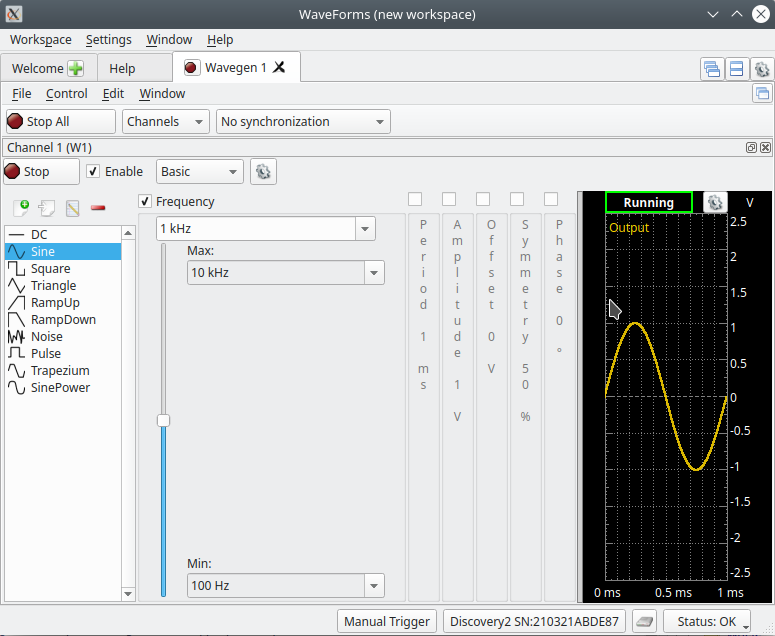
In Waveforms start the Wavegen tool and configure it with the following settings and once complete click on the ‘Run’ button to output the waveform on the W1 pin.
- Type: Sine
- Frequency: 100 Hz
- Amplitude: 4 V
- Offset: 0 V
- Symmetry: 50 %
- Phase: 0 °
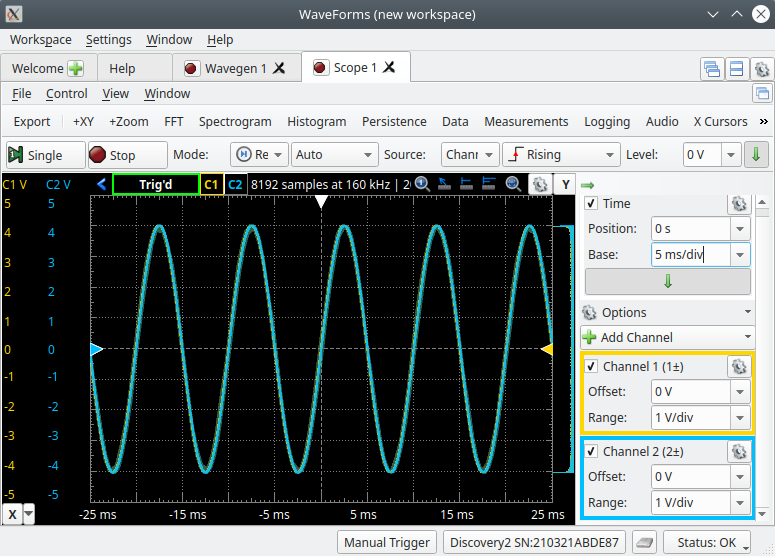
With the Wavegen tool still running launch the Scope tool and adjust its settings so both of the incoming waveforms are displayed nicely on the Scopes display as shown below.
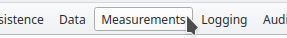
The Scope tool has the ability to make some automatic measurements on the waveforms on its display. To add a measurement you first need to open the ‘Measurements’ tool by selecting it on the top toolbar. Note, there are 2 ‘Measurements’ tools. You want the one that is in between ‘Data’ and ‘Logging’.
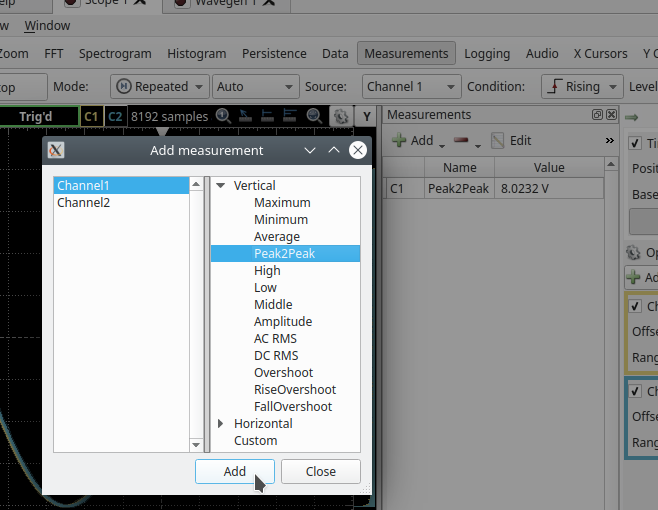
With the ‘Measurements’ tool now open, you can add a new automatic measurement by selecting the ‘Add’ dropdown and selecting ‘Defined Measurement’. We would like to measure the peak-to-peak (P2P) voltage of both the incoming channels. To do this we will first make sure that ‘Channel1’ is selected on the left-hand side of the new ‘Add Measurement’ window. Then under ‘Vertical’ select ‘Peak2Peak’. With these selected click on the ‘Add’ button to add the measurement to the ‘Measurements’ window. Continue by first selecting ‘Channel2’ on the left-hand side and then ‘Add’ to add the peak-to-peak measurement for channel 2. We can also add a measurement for the frequency by selecting either channel (they have the same frequency) and under ‘Horizontal’ select ‘Frequency’ and then click on the ‘Add’ button. You can now ‘Close’ the ‘Add Measurement’ window and see that both of these measurements have been added to your Measurements tool.
Cutoff Frequency:
In electronic filter circuits cutoff frequency applies to an edge in a low-pass, high-pass, band-pass, or band-stop filter. It is the frequency characterizing a boundary between a pass-band (allowed frequencies) and a stop-band (blocked frequencies). Typically this point is defined as the half-power point (a frequency for which the output of the circuit is −3 dB of the nominal pass-band value). As a voltage ratio this is a decrease of (1/√2 ≈ 0.707) of the pass-band voltage.For a RC filter the theoretical cutoff frequency can be calculated with the following equation. \[f_C = \frac{1}{2 \pi R C}\]
With the ‘Measurements’ for both the peak-to-peak input voltage and peak-to-peak output voltage now being displayed on the Scope adjust the input frequency using the Wavegen tool to the frequencies listed below. For each frequency record both the input voltage and output voltage in the appropriate place on the results sheet. The instructions for measuring the Cutoff frequency can also be found below. Make sure to adjust the Scopes Time Base so at least 2 cycles of the waveform for each frequency is displayed on the Scopes screen and no more than 10 cycles to obtain an accurate measurement. Observe what happens to the magnitude and phase of the output voltage relative to the input voltage as the frequency increases.
- 100 Hz
- 500 Hz
- 1000 Hz
- 2000 Hz
- Cutoff frequency (fC)
- 5000 Hz
- 10 kHz
- 20 kHz
- 100 kHz
Note: The Wavegen tool in Waveforms allows you to make small adjustments to the frequency using a slider. Which is useful while trying to find the cutoff frequencies. To do this you need to change the tool from ‘Simple’ to ‘Basic’. Once there you can change which sliders you would like displayed by using the checkboxes and also set the sliders Max and Min values using the textboxes to make the slider more or less sensitive.
- Cutoff Frequency - Increase the input Wavegen frequency from the a starting frequency of 100 Hz, until the output voltage (capacitor voltage) decreases to (1/√2) of the input voltage. At this point the output voltage will also be lagging the input voltage by 45°. Record the frequency, input voltage and output voltage in the appropriate place on the results sheet.
Once you have completed all of the measurements for this section, Stop the Wavegen tool so there is no voltage applied to the circuit so you can make changes to the circuit in the next section.
2.2 High-pass RC Filter
Passive high-pass filters
A high pass filter allows high frequency signals to pass through unchanged, but attenuates low frequency signals.
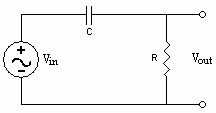
Figure 2.3: A RC High Pass Filter
Looking at the output of this circuit in terms of generalized impedances: \[V_{out}=\frac{R}{R+(1/j\omega C)} \times V_{in}\] If \(\omega\) is very large, the input signal will be largely unchanged when it passes through the filter. If \(\omega\) is small, the fraction that multiplies \(V_{in}\) becomes small, and \(V_{in}\) is attenuated.
A high pass filter can also be obtained by taking the voltage across the inductor in a series resistor-inductor circuit.
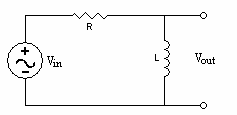
Figure 2.4: A RL High Pass Filter
Modify the circuit from the Low-pass RC filter to obtain the following circuit. This can be obtained by interchanging the 470Ω resistor with the 100nF capacitor so the channel 2 output voltage is now taken across the resistor instead of the capacitor.

Figure 2. High-pass RC Filter Circuit
Click here to see a simulation demo of this circuit.Using a similar procedure as in the last section, measure both the peak-to-peak input voltage and peak-to-peak output voltage for the same input frequencies as before. For each frequency record both the input voltage and output voltage in the appropriate place on the results sheet. The instructions for measuring the Cutoff frequency can also be found below. Remember to adjust the Scope settings for each frequency so between 2 and 10 cycles of the waveform are shown on the display. Observe what happens to the magnitude and phase of the output voltage relative to the input voltage as the frequency increases, note how this compares to the previous circuit.
- Cutoff Frequency - Increase the input Wavegen frequency from the a starting frequency of 100 Hz, until the output voltage (resistor voltage) increases to (1/√2) of the input voltage. At this point the output voltage will also be leading the input voltage by 45°. Record the frequency, input voltage and output voltage in the appropriate place on the results sheet.
Once you have completed all of the measurements for this section, Stop the Wavegen tool so there is no voltage applied to the circuit so you can make changes to the circuit in the next section.
2.3 Low-pass RL Filter
Modify the circuit from the High-pass RC filter to obtain the Low-pass RL filter circuit shown below. This can be obtained by exchanging the 100nF capacitor with a 10mH inductor.

Figure 3. Low-pass RL Filter Circuit
Click here to see a simulation demo of this circuit.Using a similar procedure as in the previous sections, again measure both the peak-to-peak input voltage and peak-to-peak output voltage for the input frequencies listed below. For each frequency record both the input voltage and output voltage in the appropriate place on the results sheet. The instructions for measuring the Cutoff frequency can also be found below. Remember to adjust the Scope settings for each frequency so that between 2 and 10 cycles of the waveform are shown on the display. Observe what happens to the magnitude and phase of the output voltage relative to the input voltage as the frequency increases, note how this compares to the previous 2 circuits.
- 100 Hz
- 1000 Hz
- 2000 Hz
- 5000 Hz
- Cutoff frequency (fC)
- 10 kHz
- 20 kHz
- 50 kHz
- 100 kHz
Note:
For a RL filter the theoretical cutoff frequency can be calculated with the following equation. \[f_C = \frac{R}{2 \pi L}\]- Cutoff Frequency - Increase the input Wavegen frequency from the a starting frequency of 100 Hz, until the output voltage (resistor voltage) decreases to (1/√2) of the input voltage. At this point the output voltage will also be lagging the input voltage by 45°. Record the frequency, input voltage and output voltage in the appropriate place on the results sheet.
Once you have completed all of the measurements for this section, Stop the Wavegen tool so there is no voltage applied to the circuit so you can make changes to the circuit in the next section.
2.4 Band-pass RLC Filter
Passive band pass filters
A band pass filter utilizes the properties of capacitors and inductors to attenuate both high and low frequency signals, and allow only those signals falling within a certain frequency “band” to pass through. This can be done with both parallel and series RLC circuits. In this lab, the series RLC circuit will be used to demonstrate a band pass filter.
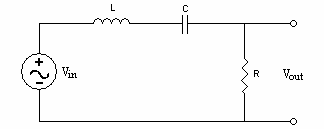
Figure 2.3: A Band Pass Filter
Looking at the output of this circuit in terms of generalized impedances: \[V_{out}=\frac{R}{R+j\omega L+(1/j\omega C)}\times V_{in}\] If \(\omega\) is sufficiently large or small, the fraction that \(V_{in}\) is multiplied by will become small, and the signal will be attenuated. However, for the frequency band corresponding \(|j\omega L|\approx|1/(j\omega C)|\), the signal will pass through with little or to no change.
Resonant Frequency
The Resonant frequency for a LC circuit occurs when it is driven from an external source at an frequency which the inductive and capacitive reactances are equal in magnitude. For a series Band-pass RLC circuit, at resonant frequency, the voltage across the inductor and the capacitor are equal but 180 degrees out of phase; Therefore, these 2 voltages cancel each other out and all of the input voltage is then passed to the output (as resistor voltage).
For a series Band-pass RLC filter the theoretical resonant frequency can be calculated with the following equation. \[f_R = \frac{1}{2 \pi \sqrt{L C}}\]
Modify the circuit one last time from the Low-pass RC filter to obtain the Band-pass RLC filter circuit as shown below. This can be obtained by adding the 100nF capacitor in series with the 10mH inductor. When doing so make sure that the Wavegen input and Scope outputs are moved if necessary to the appropriate places.

Figure 4. Band-pass RLC Filter Circuit
Click here to see a simulation demo of this circuit.Again, using a similar procedure as in the previous sections, measure both the peak-to-peak input voltage and peak-to-peak output voltage for the input frequencies listed below. For each frequency record both the input voltage and output voltage in the appropriate place on the results sheet. The instructions for measuring the Lower/Upper cutoff and Resonant frequencies can be found below. Remember to adjust the Scope settings for each frequency so that between 2 and 10 cycles of the waveform are shown on the display. Observe what happens to the magnitude and phase of the output voltage relative to the input voltage as the frequency increases, note how this compares to the previous 3 circuits.
- 100 Hz
- 1000 Hz
- Lower cutoff frequency (fLower)
- 4000 Hz
- Resonant frequency (fR)
- 6000 Hz
- Upper cutoff frequency (fUpper)
- 50 kHz
- 100 kHz
Resonant Frequency - Adjust the input Wavegen frequency until the phase of the output voltage is in phase with the input voltage. At this point the output voltage will also be at a Maximum, theoretically equal to the input voltage. Record the frequency, input voltage and output voltage in the appropriate place on the results sheet.
Lower Cutoff Frequency - Decrease the input Wavegen frequency from the resonant frequency, measured above, until the output voltage (resistor voltage) equals (1/√2) of the input voltage. At this point the output voltage will be leading the input voltage by 45°. Record the frequency, input voltage and output voltage in the appropriate place on the results sheet.
Upper Cutoff Frequency - Increase the input Wavegen frequency from the resonant frequency, measured above, until the output voltage (resistor voltage) equals (1/√2) of the input voltage. At this point the output voltage will be lagging the input voltage by 45°. Record the frequency, input voltage and output voltage in the appropriate place on the results sheet.
2.5 Cleanup
Congratulations, you have completed the experimental part of the the laboratory. Before cleaning up, I’d suggest going through your results to check that you have completed everything and that your results make sense. If you find any issues, I’d suggest resolving or making a note of it now. If you are not continuing to work with the equipment please disconnect everything and put it away to prevent it from getting damaged.
3 Post Lab
The following is what you are expected to complete and submit for grading for Lab 6 before the deadline.
The completed Lab 6 - Results sheet template provided at the beginning of this lab manual under Equipment required. This sheet should include the following:
- Your name, student ID and CCID.
- All of the required measurements from the lab procedures.
- All of the required calculations as discussed below.
- The required plots as discussed below.
The Lab 6 - Results sheet needs to be submitted to the Submit (Lab 6 - Results) link on eClass as a pdf document .
- Complete the online Quiz (Lab 6 - Post Lab) on eClass.
3.1 Calculations
For these calculation you only need to provide the answers in the space provided on your results sheet, you do not need to show your work.
- Calculate the attenuation factor (Vout/Vin) for all measured frequencies for all four of the filters tested. Include your calculations in the appropriate place on the results sheet.
3.2 Plots
To create your plots you can use whichever software you would like (Excel, Matlab, etc), export your plot as an image and import it into your Lab 6 - Results sheet in the appropriate place.
Your plots should include:
- A Plot title
- Label your axes and show what unit of measure is used.
- Include a marking for your datapoints.
- Include a line between your datapoints in the same series.
- Include a legend.
- Make sure your scales are appropriate and visible.
RC Low-pass and High-pass Filters: Plot Vout/Vin for both the RC Low-pass and High-pass Filters vs. Frequency (Hz) – Use a log scale for both the y and x axes.
RL Low-pass Filter: Plot Vout/Vin for the RL Low-pass Filter vs. Frequency (Hz) – Use a log scale for both the y and x axes.
RLC Band-pass Filter: Plot Vout/Vin for the RLC Band-pass Filter vs. Frequency (Hz), – Use a log scale for both the y and x axes.
3.3 Questions
Complete the online Quiz (Lab 6 - Post Lab) on eClass.