Lab 4 - Phasors and AC Power
ECE209 - Fundamentals of Electrical Engineering
Electrical and Computer Engineering - University of Alberta
1 Objectives
In the fourth lab students will continue their experiments on AC Circuits from the previous lab. They will use the circuits to explore phasors and AC power concepts for resistors, capacitors and inductors. The main objectives for this lab are as follows:
Continue with a few demonstrations of the equipment to show some of their functions and limitations.
Use the oscilloscope to show both the voltage and current sinewaves across a resistor, a capacitor and inductor to show how the different components produce different phase shifts between their voltage and current waveforms. Then take those waveforms and transform them into their phasor representation. Also demonstrate the ac power flow through these components.
Experiment with a series RCL circuit and a parallel RC circuit to demonstate Kirchoffs Law’s for AC circuits and how the impedence and power flow of these circuits is effected by frequency.
These objectives should be kept in mind as the students work through the lab procedure.
2 Pre-Lab
Before attending the lab, please complete the following:
Note:
Labs are typically completed in groups of two, so please try to pair up before coming to the lab. Each student needs to complete the pre-lab and hand it in at the start of their scheduled lab session. Only one lab report is required to be handed-in per group which is due one week after the schedule lab session. If you can’t find a partner we will either pair you up in the lab or you may also be permitted to work by yourself if there is an available station.
Completely read through the information discussed in the Background section below and please skim through this lab manual to become familiar with what will be required of you during the lab.
Familiarize yourself with the Equipment used in the first lab by going though the pages for each piece of equipment in the Equipment List.
Make sure you have either an electronic device with you where you can access this lab manual or print out the Lab 4 - Manual before coming to your lab section.
Make sure you print out a Lab 4 - Results Sheet to record all of your results. You only require one printout per group.
Complete these Pre-lab Questions on a seperate piece of paper to hand in at the beginning of your lab session. Make sure to include an appropriate title, your first and last name, CCID, student ID and your lab section at the top of the page. Everything in light green on the results sheet is what you should have filled in as well for your prelab.
Describe in your own words what the Power Triangle is. Use an example to demonstrate.
Calculate the frequency that you need to apply to both a 1µF capacitor and a 2.5mH inductor so the reactance of the component equals 50Ω. Show your work and place your results in the appropriate place in the Function Generator - (ZOUT) section on the results sheet.
Calculate the impedance at the applied frequency for the components in the Phasors and AC Power section. Show your work and place your results in the appropriate place on the results sheet.
Calculate the total impedance of the Series RCL circuit for the 3 different applied frequencies. Show your work for the 1.8 kHz case. Place your results in the appropriate place in the results sheet.
Calculate the total impedance of the Parallel RC circuit for the 3 different applied frequencies. Show your work for the 400 Hz case. Place your results in the appropriate place in the results sheet.
2.1 Background
3 Procedure
3.1 Equipment Familiarization
3.1.1 Oscilloscope (AC Coupling)
Demostrate the effect AC Coupling has when a dc-offset is added on to the output of the function generator.
- Using 2 banana to bnc cables connect the output of the function generator to the input of channel 1 of the oscilloscope.
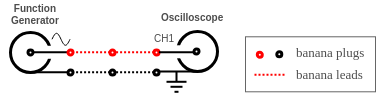
figure 1. AC coupling test circuit
Setup the function generator to output a 1 kHz sinewave with no dc-offset and maximum output voltage.
Setup the oscilloscope to appropriately view the output waveform of the function generator. Make sure that the ‘Coupling = DC’ and ‘Probe = 1X’ in the vertical menu for channel 1. Also add a ‘Cyc RMS’ Measure for channel 1.
Decrease the output amplitude of the function generator until you get approximately 1VRMS.
Using the appropriate controls on the function generator add a dc-offset to the output and note what happens to the displayed waveform. It should either move up or down on the display.
With a dc-offset on the currently displayed waveform change the ‘Coupling’ setting on channel 1 of the oscilloscope from ‘DC’ to ‘AC’ and note what happens to the displayed waveform.
Note:
The DC component of the waveform is no longer displayed on the oscilloscope, it removes it. Note that the function generator still has the dc-offset on its output the oscillscope is just not showing it. ‘DC Coupling’ displays both DC and AC components of the waveform while ‘AC Coupling’ displays the AC component while blocking the DC component.Set both channel 1 and 2 on ‘AC Coupling’ for the remainder of this lab. Also disable the dc-offset on the function generator.
Note:
Some of the function generators produce a small dc-offset even when the dc-offset function is disabled. This dc-offset of the function generator can cause errors in our measurements, for all the experiments have AC coupling enabled on both channels of the oscilloscope.Adjust the output voltage of the function generator until the voltage measures 5 volt rms on the oscilloscope. This amplitude setting should remain constant for the entire next section do not adjust the output level knob. The frequency should also initially be set to 1kHz.
Note:
Adjusting the frequency on the function generator should have no effect on the output voltage.
3.1.2 Function Generator - (ZOUT)
Demostrate how the output voltage of a function generator is effected by the connected load impedance due to the function generators output impedance. The function generators output impedance is approximately 50Ω.

figure 2. Function generator output impedance
Resistor Load
Using the circuit from the previous step measure the open circuit output rms voltage of the function generator using the oscilloscope (should be ~5Vrms). Record your result in the appropriate place on the results sheet.
Set the decade box to 100Ω and add it to the output of the function generator as shown below:
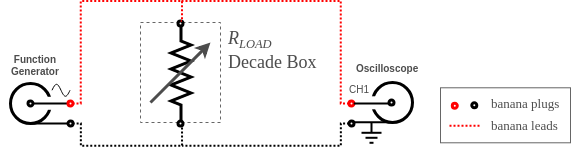
figure 3. Function generator with a variable resistor load
Use the oscilloscope to again measure the output rms voltage of the function generator now with the load attached to it and record it in the appropriate place on the results sheet. Also record the output rms voltage measurements for decade box resistances of 50Ω, 20Ω and a short-circuit.
Capacitor Load
Replace the decade box with the 1μF capacitor as shown in the circuit below:
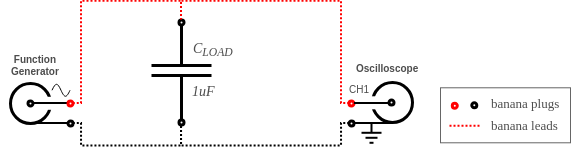
figure 4. Function generator with a capacitor load
With the capacitor as a load adjust the frequency of the function generator until its output matches the frequency you calculated in the pre-lab. Record both the output rms voltage and frequency in the appropriate place in the results sheet.
Inductor Load
- Replace the 1μF capacitor with the 2.5mH inductor as shown in the circuit below:
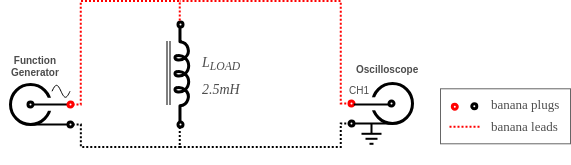
figure 5. Function generator with an inductor load
- With the inductor as a load adjust the frequency of the function generator until its output matches the frequency you calculated in the pre-lab. Record both the output rms voltage and frequency in the appropriate place in the results sheet.
3.1.3 Scope vs. DMM - (RMS)
Compare the the RMS voltage measurements of both a digital multimeter (DMM) and an oscilloscope (Scope) at different frequencies to show the DMM’s frequency limitations.
- Connect the following circuit:
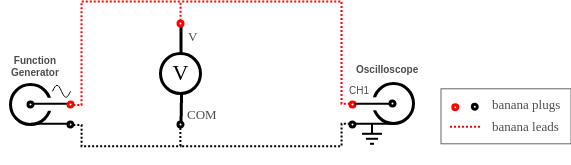
figure 6. DMM frequency test circuit
Setup the function generator to output a 1 kHz sinewave with no dc-offset and maximum output voltage.
Setup the Scope to view the output waveform of the function generator and to measure both the rms output voltage and the frequency using automatic measurements.
Setup the DMM to read AC voltage and set the ‘Manual Range’ to 60V using the ‘RANGE’ button. This multimeter when in ‘Auto Range’ intellegently selects the appropriate range to use for the applied voltage however each has different impedance characterists which we want to currently ignore.
In the appropriate place in the results sheet record both rms voltage indicated by both the DMM and the Scope.
Note:
Currently both of the measurements made by the DMM and Scope should be approximately the same.Using the voltage you just measured with the DMM calculate the setpoint voltages for the attenuation values of 0.707, 0.5 and 0.25 by multiplying your measured voltage by those attenuation values and record your results in the appropriate place in the results sheet.
Increse the frequency of the function generator until the voltage measured by the DMM corresponds to the values you calculated in the previous step. At each setpoint (0.707, 0.5 and 0.25) record the frequency and the rms voltage measured by both the DMM and the Scope.
3.2 Phasors and AC Power
Note:
To demonstate the current waveform we are going to use a sense resistor (RSENSE = 10Ω). In an ideal resistor the voltage waveform and the current waveform are identical with the current just being scaled by the resistor value. To scale the current properly with a 10Ω resistor the voltage magnitude values need to be divided by 10 to get the current in amps.
3.2.1 Resistor - (200Ω)
Use the following circuit to demostrate what the current and voltage waveforms look like for a resistor.
- Connect the following circuit. Use two 100Ω resistors in series for the 200Ω resistor. Note that both channel grounds of the oscilloscope connect to the same point between the 200Ω and 10Ω resistors.

figure 7. Resistor VI phasor and power test circuit
Set the function generator to output a 4.0kHz sinewave with no dc-offset at maximum output voltage.
Set the oscilloscope to:
- AC coupling for both channels.
- Probe should be set for 1X for both channels.
- Channel 2 should be set for Invert = On.
- Adjust the vertical position of both channels until they are both at the center of the display.
- Setup the automatic measurements to measure the period and Cyc RMS of CH1 and the Cyc RMS of CH2.
- Adjust the vertical and horizontal controls so the waveforms are displayed properly on the screen, adjust them as necessary for each measurement.
Adjust the function generator output voltage until the voltage across R1 (CH1 - Cyc RMS) equals 5.0 VRMS. Your oscilloscope screen should now be similar to the image below:

figure 8. Oscilloscope setup to measure V and I waveforms
- Use the oscilloscope to measure the following and record your results in the appropriate place on the results sheet.
- Period - The time in microseconds for one cycle.
- VRMS - The RMS voltage across the 200Ω resistor.
- IRMS - The current through the 200Ω resistor. This current is the RMS voltage measured across RSENSE divided by 10Ω.
- TI-V - The phase time difference between the voltage and current waveforms. This time should have a sign: positive for a lagging current and negative for a leading current.
- lead/lag - Note weather the current waveform leads or lags the voltage waveform as shown on the scope.
3.2.2 Capacitor - (1μF)
Use the following circuit to demostrate what the current and voltage waveforms look like for a capacitor.
- Replace the two 100Ω resistors with the 1μF capacitor as shown in the circuit below:

figure 9. Capacitor VI phasor and power test circuit
Change the frequency output the function generator to 796 Hz as this is the frequency where the capacitor has an impedance of 200Ω (the same as the resistor in the previous part).
Adjust the output voltage of the function generator to maintain a voltage across C1 equal to 5.0 VRMS.
Use the oscilloscope to make the same measurements that you made in the previous section with the resistor and record your results in the appropriate place on the results sheet.
3.2.3 Inductor - (2.5mH)
Use the following circuit to demostrate what the current and voltage waveforms look like for an inductor.
- Replace the 1μF capacitor with the 2.5mH inductor as shown in the circuit below:
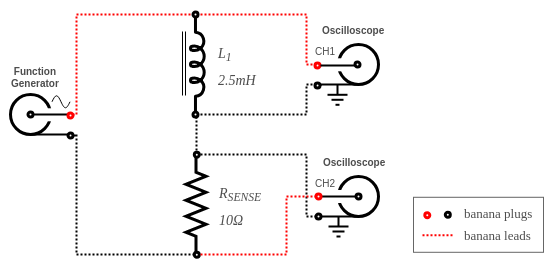
figure 10. Inductor VI phasor and power test circuit
Change the frequency output the function generator to 12.7 kHz as this is the frequency where the indcutor has an impedance of 200Ω (the same as the resistor and capacitor in the previous parts).
Adjust the output voltage of the function generator to maintain a voltage across L1 equal to 5.0 VRMS.
Use the oscilloscope to make the same measurements that you made in the previous sections with the resistor and capacitor and record your results in the appropriate place on the results sheet.
3.3 Series RCL Circuit - (KVL)
Use the following circuit to show how an series RCL circuit behaves while different frequencies are applied to it.
- Connect the following circuit.

figure 11. Series RCL circuit (setup 1)
Set the function generator to output a 1.80 kHz sinewave with no dc-offset at maximum output voltage.
Set the oscilloscope to:
- AC coupling for both channels.
- Probe should be set for 1X for both channels.
- Channel 2 should be set for Invert = Off.
- Adjust the vertical position of both channels until they are both at the center of the display.
- Setup the automatic measurements to measure the period and Cyc RMS of CH1 and the Cyc RMS of CH2.
- Adjust the vertical and horizontal controls so the waveforms are displayed properly on the screen, adjust them as necessary for each measurement.
Adjust the function generator output voltage until the voltage across R1 (CH1 - Cyc RMS) equals 4.0 VRMS.
Use the oscilloscope to measure the following and record your results in the appropriate place on the results sheet.
- tS - The time in microseconds for one cycle.
- VR - The RMS voltage across the 100Ω resistor.
- IS - The current through the 100Ω resistor. This current is the RMS voltage measured across R1 divided by 100Ω.
- VS - The RMS output voltage of the function generator.
- tR-S - The phase time difference between the resistor voltage (VR) and the source voltage (VS). This time should have a sign: positive if the source voltage lags the resistor voltage and negative if it leads.
Move the channel 2 oscilloscope probe as shown in the circuit (setup 2) below.

figure 12. Series RCL circuit (setup 2)
Continue to use the oscilloscope to measure the following and record your results in the appropriate place on the results sheet.
- VRL - The RMS output voltage across both the resistor and inductor.
- tR-RL - The phase time difference between the resistor voltage (VR) and the resistor-inductor voltage (VRL). This time should have a sign: positive if the resistor-inductor voltage lags the resistor voltage and negative if it leads.
Move the channel 2 oscilloscope probe to the original location as shown in setup 1.
Adjust the the function generator to output a frequency of 3.2 kHz and repeat steps d-h.
Adjust the the function generator to output a frequency of 4.6 kHz and again repeat steps d-h.
3.4 Parallel RC Circuit - (KCL)
Use the following circuit to show how a parallel RC circuit behaves while different frequencies are applied to it.
- Connect the following circuit. RSS and RSC are current sense resistors to measure the source current and the capacitor current respectively. As the impedance of these resistors are small compared to the other impedances in the circuit the voltages they drop can be ignored.
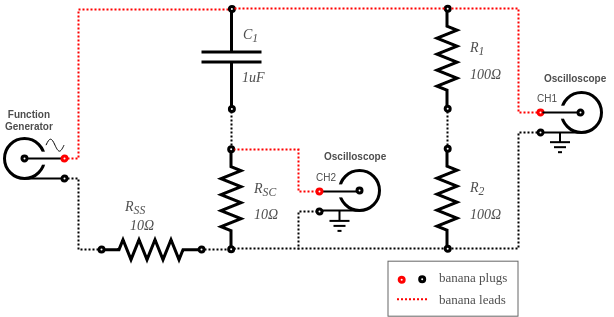
figure 13. Parallel RC circuit (setup 1)
Set the function generator to output a 400 Hz sinewave with no dc-offset at maximum output voltage.
Set the oscilloscope to:
- AC coupling for both channels.
- Probe should be set for 1X for both channels.
- Channel 2 should be set for Invert = Off.
- Adjust the vertical position of both channels until they are both at the center of the display.
- Setup the automatic measurements to measure the period and Cyc RMS of CH1 and the Cyc RMS of CH2.
- Adjust the vertical and horizontal controls so the waveforms are displayed properly on the screen, adjust them as necessary for each measurement.
Adjust the function generator output voltage until the voltage across R1 + R2 (CH1 - Cyc RMS) equals 5.0 VRMS.
Use the oscilloscope to measure the following and record your results in the appropriate place on the results sheet.
- tS - The time in microseconds for one cycle.
- VR - The RMS voltage across the two 100Ω resistors in series.
- IR - The current through the 100Ω resistors. This current is the RMS voltage measured across R1 and R2 divided by 200Ω.
- IC - The current through the capacitor. This current is the RMS voltage measured across RSC divided by 10Ω.
- tR-C - The phase time difference between the resistor current (IR) and the capacitor current (IC). This time should have a sign: positive if the capacitor current lags the resistor current and negative if it leads.
Move the channel 2 oscilloscope probe as shown in the circuit (setup 2) below.
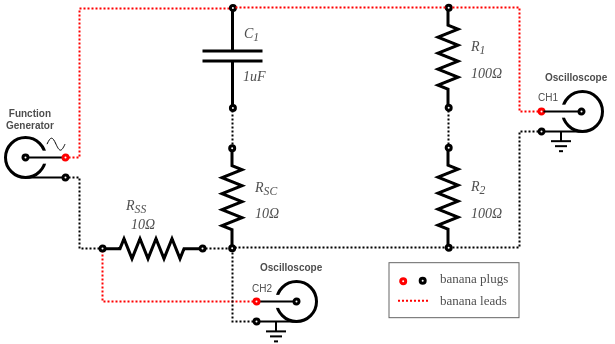
figure 14. Parallel RC circuit (setup 2)
Adjust channel 2 of the oscilloscope to Invert = On.
Continue to use the oscilloscope to measure the following and record your results in the appropriate place on the results sheet.
- IS - The RMS output current of the function generator.
- tR-S - The phase time difference between the resistor current (IR) and the source current (IS). This time should have a sign: positive if the source current lags the resistor current and negative if it leads.
Move the channel 2 oscilloscope probe to the original location as shown in setup 1.
Return channel 2 of the oscilloscope to Invert = Off.
Adjust the the function generator to output a frequency of 800 Hz and repeat steps d-j.
Adjust the the function generator to output a frequency of 1.2 kHz and again repeat steps d-j.
3.5 Clean-up
- Cleanup your station, everything should be returned to where you got it from. Verify your results with an instructor or TA to show that you have completed everything and once everything is completed and tidy get a signature on your Results page before you leave.
4 Post-Lab
The following is what you are expected to hand-in one week (by 4:00pm) after completion of the lab. You only have to hand-in one copy per group. There is an assignment box in the D-ICE pedway located just before the elevators marked ECE209 Lab. Please staple everything together in the following order:
Use the first page of your Result Sheet as your cover page. Make sure your names, student IDs, CCID’s and lab section are clearly writen in the table at the top of the page. Your results sheet should be signed twice by the laboratory instuctor or teaching assistant, once at the beginning of the lab to show that you have completed your prelab and once when you have completed the lab and finished cleaning up.
The remaining completed Results Sheets in order with all calculations, results and graphs as required.
The completed Post-lab Questions below on a separate piece of paper.
4.1 Calculations
Complete the tables on your Results sheet by completing the following calculations:
For the Phasors and AC Power section calculate the following for each component:
- θ - angle in degrees between the voltage the current.
- Z - total impedance of the component using ohms law.
- S - the apparent power in the component.
- Q - the reactive power in the component.
- P - the real power in the component.
For the Series RLC Circuit section calculate the following for each applied frequency:
- IS - The supply current. Use the resistors voltage as the reference angle.
- θ - The supply voltage angle relative to the resistor voltage angle.
- δ - The RL voltage angle relative to the resistor voltage angle.
- VL - The voltage across the inductor.
- α - The inductor voltage angle relative to the resistor voltage angle.
- VC - The voltage across the capacitor.
- β - The capacitor voltage angle relative to the resistor voltage angle.
- Z - Total impedance of the RLC circuit using ohms law.
- S - The apparent power coming from the supply.
- Q - The reactive power coming from the supply.
- PS - The real power coming from the supply.
- PR - the real power dissipated in the resistor.
- PLC(loss) - The real power dissipated in both the inductor and capacitor.
For the Parallel RC Circuit section calculate the following for each applied frequency:
- IR - The resisors current. Use the resistors current as the reference angle.
- δ - The capacitor current angle relative to the resistor current angle.
- θ - The supply current angle relative to the resistor current angle.
- Z - Total impedance of the RC circuit using ohms law.
- S - The apparent power coming from the supply.
- Q - The reactive power coming from the supply.
- P - The real power coming from the supply.
4.2 Graphs
Using the provided graphs in your results sheet make the following plots:
Phasor Diagrams – Resistor, Capacitor, Inductor - Plot the voltage and current phasors for each component on the appropriate plot on the result sheet. Don’t worry about the scales on the phasors just make sure to label the voltage, current and the angle with their magnitudes.
Series RCL Circuit - Phasor Diagram - Plot the following phasors on the diagram provide on the results sheet for each frequency: VR(ref), VS, VRL, VL, VC.
Series RCL Circuit - Power Triangle - Draw the Power Triangle (S, Q, PS) for each frequency on the plot provide on the results sheet.
Parallel RC Circuit - Phasor Diagram - Plot the following phasors on the diagram provide on the results sheet for each frequency: IR(ref), IC, IS.
Parallel RC Circuit - Power Triangle - Draw the Power Triangle (S, Q, P) for each frequency on the plot provide on the results sheet.
4.3 Questions
Answer the following questions on a separate piece of paper to hand in with your Results Sheet. Make sure to include an appropriate title, your first and last name, CCID, student ID and your lab section at the top of the page.
Use your results from the Function Generator - (ZOUT) to demonstrate that the output impedance of the function generator is approximately 50Ω and mostly resistive.
Does the digital multimeter measure high frequency voltages well? Use your results to explain your answer?
For the Series RLC Circuit explain in your own words what is happening to both the total circuit impedances` magnitude and phase while you increase the frequency from 1.8 kHz to 4.6kHz. As a result of this impedance change also describe what happens to the power triangle during this frequency transistion. Use your results to support your answer.
For the Series RLC Circuit use your results to demostrate that Kirchoffs Voltage Law holds true for AC Circuits.
For the Parallel RC Circuit use your results to demostrate that Kirchoffs Current Law holds true for AC Circuits.