Lab 3: Induction Motors
ECE332 - Electrical Machines
Electrical and Computer Engineering - University of Alberta
1 Introduction
1.1 Laboratory Goals
The purpose of this lab is to illustrate the operation of induction motors and continue experience with 3-phase electrical measurements as well as torque and speed measurements. Familiarization of the induction machine equivalent circuit model is explored by carrying out tests to determine the machines parameters. The equivalent circuit model accuracy is then compared to the actual performance of measurements taken.
1.1.1 Circuits
Circuit 1A: Induction Motor Load Test
Circuit 1B: No-load Test
Circuit 1C: Synchronous Speed Test
Circuit 1D: Locked Rotor Test (aka Short-circuit)
Circuit 2: DC Winding Resistance Test
1.2 Equipment
List of Equipment used for this Laboratory Experiment.
Power Supply – Model 8525-20
Data Acquisition and Control Interface (DACI) – Model 9063
2kW Four-pole Squirrel-cage Three-phase Induction Machine – Model 8503
Wiring Module for Squirrel-cage Induction Machine – Model 8504
2kW Four-quadrant Dynamometer – Model 8540
Safety banana Leads – 3 Colors, 3 Lengths
Computer running LVDAC-EMS software
Accessories – (USB cable, Barrel Power Cable)
2 Theory
Like other machines, an induction machine has a rotor circuit and a stator circuit. Unlike other machines, the rotor circuit does not need to be connected to an external supply. The rotor conductors can be short circuited, forming a “cage”. The machines in the lab experiments are cage induction motors. The stator of a 3-phase induction motor is wound with a 3-phase winding similar to that used for a synchronous machine. Currents flowing in the stator winding create a magnetic field which rotates at synchronous speed, ωs in radians per second, ns in rpm.
\[\omega_{s} = \frac{4\pi f}{p}\]
\[n_{s} = \frac{120f}{p} = \frac{60}{2\pi}\omega_{s}\]
f is supply frequency, p is the number of poles. If the rotor rotates at a speed other than the synchronous speed, a voltage is induced in the rotor conductors, the magnitude of which is proportional to the difference between the synchronous speed and rotor speed.
\[E = sE_{0}\]
E0 is the induced voltage at standstill and s is defined as slip:
\[s = \frac{n_{s} - n_{m}}{n_{s}} = \frac{\omega_{s} - \omega_{m}}{\omega_{s}}\]
Where nm is the mechanical speed of rotation in rpm and ωm is the mechanical speed of rotation in rad s-1.
\[\omega_{m} = (1 - s)\omega_{s}\]
An induction machine can be thought of as a rotating transformer, and the circuit used to model an induction machine in steady state is similar to the transformer equivalent circuit model. Assuming the machine and supply are balanced, we can consider one phase of the three phase machine. The steady state per-phase model is shown in Figure 1. R1 and X1 are stator resistance and leakage reactance, R2 and X2 are rotor resistance and leakage reactance, referred to the stator. Xm is magnetizing reactance and RC is used to represent the core losses. I1 is the stator phase current and I2 is the rotor current, referred to the stator. Line current is a function of the 3-phase winding connection:
\[wye \rightarrow I_{L} = I_{1}\]
\[delta \rightarrow I_{L} = \sqrt{3}I_{1}\]
To simplify the analysis and the determination of a machine’s parameters the equivalent circuit shown in Figure 2 is sometimes used. With this circuit, core losses are combined with friction and windage losses to produce a total rotational loss. Precise details on how to accurately determine the equivalent circuit parameters of an induction machine can be found in IEEE Standard 112. In the lab, we will use a similar but not identical process.
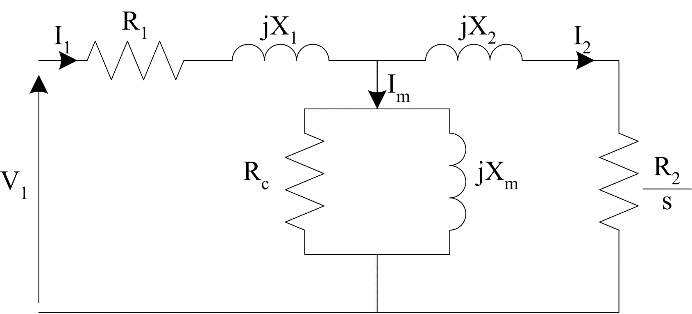
Figure 1: Per-phase equivalent circuit
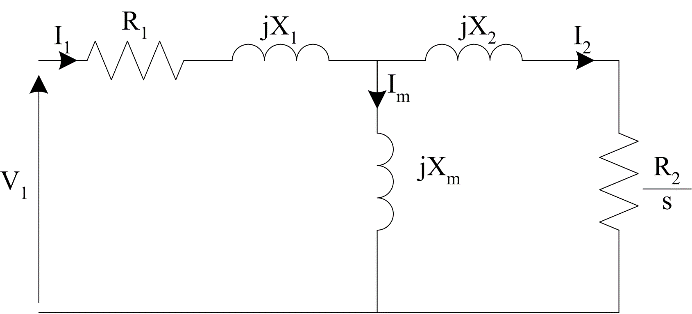
Figure 2: Simplified equivalent circuit
2.0.1 DC Resistance Test
If a DC voltage is applied to the stator terminals, there will be no potential difference across any inductance and no induced voltage on the rotor. As a result, the per-phase circuit is reduced to the stator winding resistance. Applying a DC voltage across two motor terminals and measuring the current, the stator resistance can be found. Considering Figure 3, it can be seen that the apparent impedance will depend on whether the machine is wye or delta connected.
\[wye \rightarrow R_{1} = \frac{V_{\text{DC}}}{2I_{\text{DC}}}\]
\[delta \rightarrow R_{1} = \frac{3V_{\text{DC}}}{2I_{\text{DC}}}\]
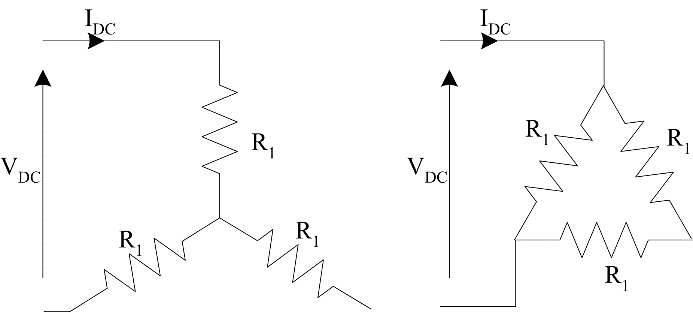
Figure 3: Winding configurations for the DC test
2.0.2 No–load / Synchronous Speed Test
During the no–load test, the machine is allowed to accelerate to nearly synchronous speed with no applied load. The machine will run close to synchronous speed, with \(s \rightarrow 0\). If the slip approaches zero, the rotor current will fall to nearly zero; which is negligible, and the circuit of Figure 2 can be replaced with the one in Figure 4. Remembering that this is a per-phase circuit we can write:
\[P_{\text{in}} = 3I_{1}^{2}R_{1} + P_{\text{rotational}}\]
\[Q_{\text{in}} = 3I_{1}^{2}(X_{1} + X_{m})\]
Where rotational losses are defined as:
\[P_{\text{rotational}} = P_{F\& W} + P_{\text{core}} + P_{\text{stray}}\]
PF&W are friction and windage losses, Pcore are core losses, and Pstray are stray load losses.
The equivalent circuit shown in Figure 4 is an approximate model of no–load test because it ignores the rotor current (which is relatively very small). This equivalent circuit is more accurate for the case when the machine is driven at synchronous speed by an external mechanical source. At synchronous speed test the PF&W and Pstray are not supplied by the machine stator terminals:
\[P_{\text{in}} = 3I_{1}^{2}R_{1} + P_{\text{core}}\]
Therefore it is possible to isolate the core losses from the friction and windage and stray losses during synchronous speed test.
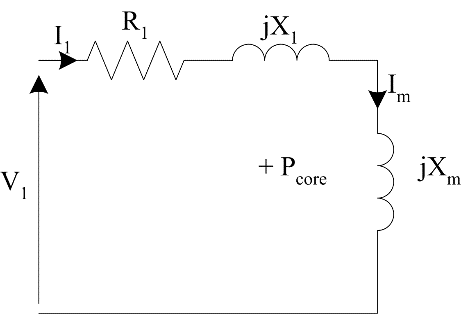
Figure 4: Equivalent circuit at synchronous speed
2.0.3 Locked Rotor Test
In the locked rotor test, the rotor of the machine is prevented from rotating and the supply voltage gradually increased until rated current is reached. When the rotor is stationary slip equals one (s = 1) and the circuit of Figure 2 can be replaced by the circuit shown in Figure 5.
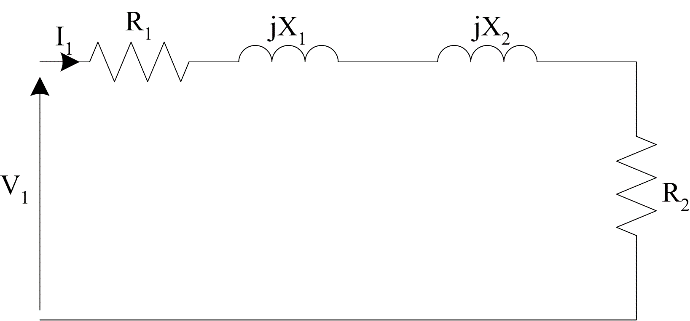
Figure 5: Locked rotor equivalent circuit
In this case:
\[P_{\text{in}} = 3I_{1}^{2}(R_{1} + R_{2})\]
\[Q_{\text{in}} = 3I_{1}^{2}(X_{1} + X_{2})\]
Ideally, this test is performed at a reduced frequency to more accurately predict the rotor resistance. We do not have this capability in the lab. If R1 is known from equation (8) or (9) then R2 can be found from (14). However, X1 and X2 can only be found from empirical data. The relative magnitude of stator and rotor leakage reactance tends to depend on the motor class. This percentage of leakage reactance due to stator or rotor is summarized in Table 1.
| Classes | X1 | X2 |
|---|---|---|
| Wound Rotor | 50% | 50% |
| Class A | 40% | 60% |
| Class B | 30% | 70% |
| Class C | 50% | 50% |
| Class D | 50% | 50% |
Using the data in Table 1, X1 and X2 may be found from equation (15), then the magnetizing inductance may be found from (11).
2.0.4 Predicted Performance
Using the equivalent circuit model of Figure 2, it is possible to predict the performance of an induction motor. The stator phase current will be given by
\[{\overrightarrow{I}}_{1} = \frac{V_{1}}{{\overrightarrow{Z}}_{\text{phase}}}\]
Where complex phase impedance is given by:
\[{\overrightarrow{Z}}_{\text{phase}} = R_{1} + jX_{1} + \frac{jX_{m}\left( \frac{R_{2}}{s} + jX_{2} \right)}{\frac{R_{2}}{s} + j(X_{2} + X_{m})}\]
The input power can be found using:
\[P_{\text{in}} = 3V_{1}I_{1}\cos\theta\]
\[P_{\text{in}} = \sqrt{3}V_{\text{LL}}I_{L}\cos\theta\]
Where:
\[\theta = \angle{\overrightarrow{Z}}_{\text{phase}}\]
Analyzing the power flow in the circuit:
\[P_{\text{in}} = P_{\text{scl}} + P_{\text{gap}}\]
Where Pscl is the stator copper loss, Pgap is the total power transferred to the rotor:
\[P_{\text{gap}} = P_{\text{rcl}} + P_{\text{mech}}\]
Where Prcl is the rotor conductor loss, Pmech the power converted to mechanical energy (sometimes called Pconv or Pdev):
\[P_{\text{mech}} = P_{\text{out}} + P_{\text{rotational}}\]
Pout is the final available mechanical shaft power (also called Pshaft) and Protational is the rotational loss. Considering the circuit,
\[P_{\text{scl}} = 3I_{1}^{2}R_{1}\]
\[P_{\text{gap}} = 3I_{2}^{2}\frac{R_{2}}{s}\]
and the rotor conductor loss is:
\[P_{\text{rcl}} = 3I_{2}^{2}R_{2}\]
Combining equations (22), (25) and (26) we find that:
\[P_{\text{mech}} = 3I_{2}^{2}R_{2}\frac{\left( 1 - s \right)}{s}\] Using the mechanical equations for power in a rotational system at steady state:
\[P_{\text{out}} = \tau_{\text{out}}\omega_{m}\]
We find the torque developed by the machine is:
\[\tau_{\text{dev}} = \frac{3I_{2}^{2}R_{2}}{s\omega_{s}}\]
Shaft torque (after rotational losses) is given by:
\[\tau_{\text{out}} = \frac{P_{\text{out}}}{\omega_{m}}\]
2.0.5 Motoring and Generating
The theory on performance predictions is developed assuming the induction machine is a motor. The vast majority of induction machines are operated as motors, but there is increasing use of induction machines as generators. The most common application of induction machines as generators is in large-scale wind turbines. In large wind farms, induction generators up to 3 or 4 MW can be used. An example torque-speed curve of a medium sized induction machine is shown in Figure 6.

Figure 6: Example of a torque-speed curve, 4 pole machine
It can be seen that as the mechanical speed goes above synchronous speed the torque becomes negative. Using the definition of slip, (4), we see that if nm > ns then slip will be negative and from (29) torque will be negative. In terms of power flow, (27) indicates that if s < 0 then mechanical power is negative. If:
\[\left| P_{\text{mech}} \right| > \left| P_{\text{scl}} + P_{\text{rcl}} \right|\]
Then the input power will also be negative (i.e. power will flow out from the terminals to the electrical system). The induction machine equations can be applied to either motoring or generating cases. When torque and power are negative it indicates the machine is generating.
3 Pre-lab
The Pre-lab is to be completed and handed-in at the beginning of your schedule lab session. You will not be allowed to participate in the Laboratory Experiments until your Pre-lab has been completed.
3.1 Pre-lab Reading
Familiarize yourself with the lab procedures and requirements by reading through the lab manual.
Familiarize yourself with the Safety Rules as well as the Equipment and Software used in the third Laboratory by viewing the information on the laboratory webpage below:
Note the equipment datasheets can be located at the bottom each page.
To access the webpage, you need to be logged-in with your CCID.
Review Induction Machine theory.
Have at least, the “ECE332 - Lab 3 – Sign-off” sheet printed off before coming to the lab.
3.2 Pre-lab Questions
The information for questions 1-7 can be found either in the Lab 5 manual or on the webpage and datasheets mentioned above. Answer the questions on a separate piece of paper to be handed-in at the beginning of your schedule lab session (Show all of your work). Make sure you clearly put your name, student ID number, CCID and your lab section at the top of the page.
What are the goals of this lab?
For the Grid Connected Load Test Is the Induction motor connected as a Wye or Delta?
For the Grid Connected Load Test what is used to reduce the large starting current of the Induction Motor? Explain why this limits the starting current.
How is the grid-connected induction motor loaded?
For the synchronous speed test what is used to turn the shaft at 1800rpm?
For the synchronous speed test why is important to verify that both the induction motor and dynamometer load both turn in the same direction?
What are the 3 test circuits used in the lab to find the equivalent circuit model parameters of the induction machine? Which test circuit gives you which parameters?
4 Lab Procedure
4.1 Startup
Login to the computer at your station. Use your CCID and password.
Connect and power the Data Acquisition and Control Interface (DACI) and launch the LVDAC-EMS software.
Make sure you use 120V, 60Hz for your system voltage and frequency
Make sure the “Work in standalone mode” is unchecked.
To setup the machines for this experiment if not already completed for the station you are working at:
Couple the induction machine to the 4-quadrant dynamometer using the rubber coupling.
Plug in 4-quadrant dynamometer in to the available 3 phase receptacle.
Attach the induction machine cable bundle to the back of wiring module using the provided connector.
4.2 Circuit 1 - Grid Connected Induction Motor
Circuit 1 is made up of 4 individual test all using the same basic circuit that measure the current, voltage and power quantities going into the motor and uses the dynamometer to control and measure the speed and torque. In the first test, the load test, you will connect the induction motor to the grid and load it through its full range using the attached dynamometer to determine the motor performance. In the second you will simply see how the motor performs unloaded, this can be useful in calculating rotational losses, and in the third you will use the dynamometer to test how the machine performs at synchronous speed where the induction motor doesn’t supply the rotational losses because it doesn’t provide any torque or rotor current at all at this speed. The fourth test, the locked rotor test, is similar to the short circuit test that was done on the transformer and is very useful in determining the equivalent circuit parameters.
4.2.1 Circuit Setup
Connect the circuit shown in Figure 7.
Connect the winding of the Induction machine stator as a wye.
Connect E1, E2, I1 and I2 as shown below in a 2 watt-meter configuration.
Use the Variable 3ph AC supply to supply the induction motor with power.
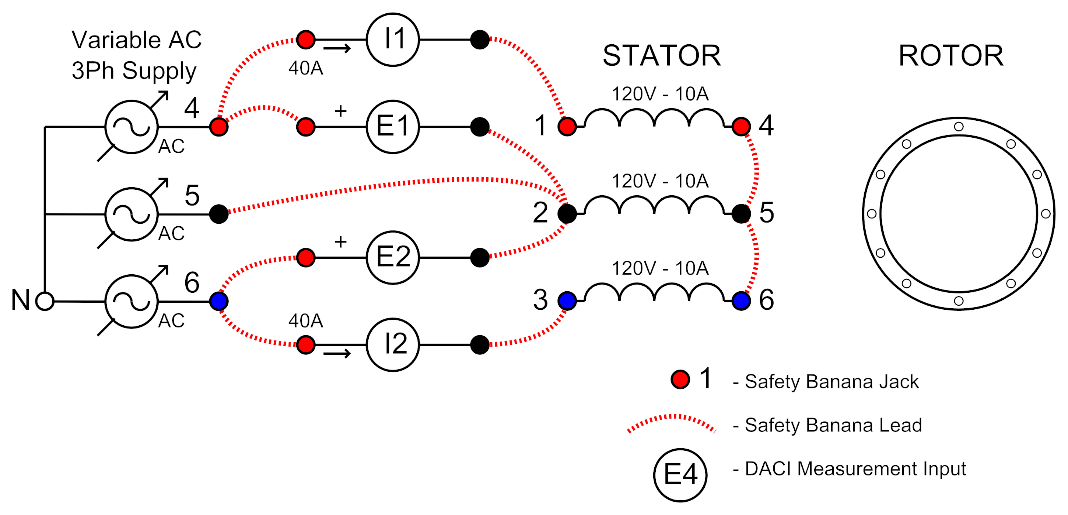
Figure 7: Motoring Setup (Circuit 1)
4.2.2 Instrument Setup
Setup the Metering Instrument as shown in Table 2.
- Make sure in the LVDAQ-EMS software that you also set the current range for I1 to be 40Amps under the “Data Acquisition and Control Settings” sidebar.
| Meter | Description | Type | Input/Function | Mode |
|---|---|---|---|---|
| M1 | A-B supply voltage | Voltage | E1 | AC |
| M2 | C-B supply voltage | Voltage | E2 | AC |
| M7 | phase A supply current | Current | I1 | AC |
| M8 | phase C supply current | Current | I2 | AC |
| M13 | 3ph Input Power | Power | PQS1 + PQS2 | P |
| M14 | 3ph Input Reactive Power | Power | PQS1 + PQS2 | Q |
| M15 | 3ph Input Apparent Power | Power | PQS1 + PQS2 | S |
| M16 | 3ph Power Factor | Power Factor | PF (EI1, EI2) | True |
- Setup the Data Table to record the data from the Metering Instrument.
4.2.3 Circuit 1A - Load Results
When you think your circuit and instrumentation is setup correctly get an instructor or TA to verify it before you apply power.
Make sure you press the continuous refresh button on the Metering Instrument so the display is updated.
Ensure the main power supply control variac is currently set at 0%.
Apply power by using the main power switch, L1, L2 and L3 should light up to indicate power.
Turn on the power supply and slowly increase the main power supply variac from 0% to 100% over about 2-3 seconds to start the induction machine from the grid.
Turn on the 4 quadrant dynamometer (dyno) by turning on the switch next to the embedded vector drive on the dyno. Once started enter “Torque Mode” on the dyno and fully load the induction machine by entering in a torque of 10.8 Nm and pressing “Start”. You should be able to monitor the speed and torque of the induction machine by going into “Monitor” on the dyno. You will need to record both of these (speed and torque) as well as the Metering Display via the Data Table for this full load set-point.
Decrease the torque by ~1Nm steps by pressing the down arrow twice and again record the speed and torque as well as the Metering Display via the Data Table. Continue this until you reach a final set-point of 0.56Nm.
Once you have captured all the torque settings above, export the Data Table to a .csv or .dat file. Save the file somewhere you will have access to after the Laboratory.
Decrease the torque on the dyno to 0 Nm and press stop to turn off the dyno. You can leave the induction machine on for the next test.
Get an instructor or TA to view your results for circuit 1A and get them to sign off on your results sheet.
4.2.4 Circuit 1B - No-load Results
With the induction motor connected to the grid with the main power supply variac set to 100% and the dyno off. Record the speed using either the “Monitor” on the dyno or the hand-held digital tachometer; also record the Metering Instruments using a clean Data Table.
Once you have this set-point, export the Data Table to a .csv or .dat file. Save the file somewhere you will have access to after the Laboratory.
Turn down the main power supply control variac back to 0% and turn off the power supply and wait for the machine to come to a standstill.
Get an instructor or TA to view your results for circuit 1B and get them to sign off on your results sheet.
4.2.5 Circuit 1C - Synchronous Speed Results
Before you start this test it is important to double check that the dynamometer and the induction motor are both turning the shaft in the same direction, this is what you are looking for in steps 19 and 20. If they are not when you turn on both machines they will fight each other by trying to spin the shaft in opposite direction which will result in very large currents.
Turn on the main power supply and increase the main power supply control variac until the induction motor just begins to rotate, note the direction of rotation and turn the variac back down to 0 and wait until the shaft stops rotating.
On the dyno enter “Speed Mode” by pressing the touch screen button. Press “Fwd” on the dyno display to start the dyno. Its speed should currently be set to 0rpm and will not be rotating but you should be able to hear the power electronics buzzing. Using the arrows on the display increase the dyno speed to 50rpm. Note the direction of rotation. This direction should be the same direction as the previous step. If not, use the “Rev” direction in “Speed Mode” instead.
If you have both the induction machine and dyno turning the shaft in the same direction go ahead and use the dyno in “Speed Mode” and get the shaft rotating to 1800rpm in the proper direction.
With the shaft rotating at synchronous speed increase the main power supply control variac, while watching the supply currents of the machine, these current should not exceed 10A. If they get larger do not continue turn the variac. If they remain small continue to increase the variac until you reach 100%.
Record the Metering Display to a clean Data Table and export the Data Table to a .csv or .dat file. Save the file somewhere you will have access to after the Laboratory.
Turn down the main power supply control variac back to 0% and turn off the power supply, once the supply is off you can also press “Stop” on the dyno. Also, press “back” to go to the main screen.
Get an instructor or TA to view your results for circuit 1C and get them to sign off on your results sheet.
4.2.6 Circuit 1D - Locked Rotor Results
On the dyno enter “Torque Mode” and enter a torque of 10.6 Nm and press “Start”.
With the main power supply control variac at 0% turn on the main power supply.
Slowly increase the main power supply control variac while watching the supply currents on the Display Instrument. Increase the variac until you get to a supply current of approximately 8.8 amps (the rated motor current). This should occur at less than 25% setting on the main control variac.
Record the Metering Display to a clean Data Table.
Turn the variac back to 0% and turn off the main power supply.
On the dyno press “Stop” and turn off the dyno by using the main breaker switch.
Export the Data Table to a .csv or .dat file. Save the file somewhere you will have access to after the Laboratory.
Get an instructor or TA to view your results for circuit 1D and get them to sign off on your results sheet.
If you have all 4 parts of circuit 1 complete you can go ahead and disconnect circuit 1.
4.3 Circuit 2 - Winding Resistance Test
This test determines the resistance of the windings, which is equivalent to R1 in the equivalent circuit model.
4.3.1 Circuit Setup
Connect the circuit shown in Figure 8.
Connect the 3 windings of the Induction machines stator in series.
Connect E1, E2 and E3 to measure the voltage across each one of the windings.
Use I1 to measure the current through all 3 windings.
Use the variable DC supply to supply a DC current through the windings.
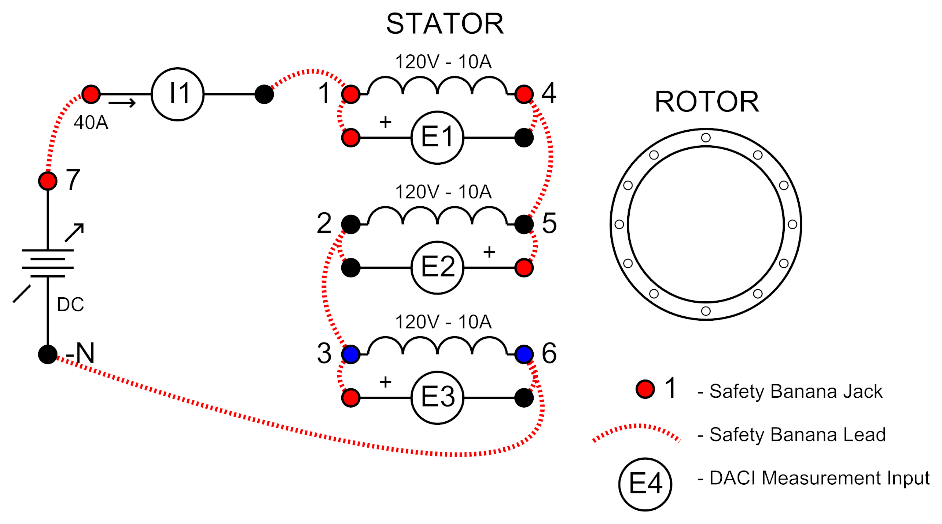
Figure 8: DC Resistance Measurement (Circuit 2)
4.3.2 Instrument Setup
- Setup the Metering Instrument as
| Meter | Description | Type | Input/Function | Mode |
|---|---|---|---|---|
| M1 | 1, 4 winding Voltage | Voltage | E1 | DC |
| M2 | 2, 5 winding Voltage | Voltage | E2 | DC |
| M3 | 3, 6 winding Voltage | Voltage | E3 | DC |
| M7 | Winding current (All 3) | Current | I1 | DC |
| M13 | 1, 4 winding Resistance | Impedance | RDC (E1, I1) | R |
- Setup the Data Table to record the data from the Metering Instrument.
4.3.3 Results
With the main power supply control variac at 0% turn on the main power supply.
Slowly increase the main power supply control variac while watching the supply currents on the Display Instrument. Increase the variac until you get to a supply current of approximately 8.8 amps (the rated motor current).
Record the Metering Display to a clean Data Table.
Turn the variac back to 0% and turn off the main power supply.
Export the Data Table to a .csv or .dat file. Save the file somewhere you will have access to after the Laboratory.
Get an instructor or TA to view your results for circuit 2 and get them to sign off on your results sheet.
4.4 Clean Up
Verify your results with an instructor or TA to show that you have completed everything.
Cleanup your station, everything should be returned to where you got it from.
Once everything is completed and tidy get a signature on your Results page before you leave.
5 Postlab
5.1 Results Spreadsheet
Once you have all the required measurements recorded in your .dat or .csv files. On the ECE332 eClass page under Lab 5, download the spreadsheet called “ECE332 – Lab 5 – Results.xlsx”. Import or Copy and Paste your results from the .dat or .csv files into the provided spreadsheet. It will automatically calculate all the required information and plot the required graphs. Print a copy of the spreadsheet tabs Results and Graphs to hand in with your report.
5.2 Sample Calculations
The following sample calculations must be handed in with your results. Use the methods that are discussed in the lab manual. (Show all your work):
Calculate R1. (Use the average of the 3 windings)
Calculate R2.
Calculate X1 and X2. (Assume a Class A motor design)
Calculate Xm.
Calculate the equivalent phase impedance at the full load (10.8 Nm) case, using your measured speed at that point.
Calculate I1, I2 and τdev using the equivalent phase impedance above for the same case above using your measured input voltage for that set-point.
Calculate PF, PIn, PSCL, PRCL, POut and Efficiency for the same case using these predicted values. Use your measured PRotational from the No-load test when necessary.
5.3 Questions
Answer the following questions to hand in with your lab report.
Explain how the equivalent circuit model does at predicting the induction motors performance. Suggest at least one source of error in the tests to find the equivalent circuit parameters.
When motoring, explain why efficiency stay fairly high when loaded and drops off quickly once the induction motor approaches synchronous speed?
From your predicted results, what applied torque would stall a running induction machine? What is this torque level commonly called?
From your predicted results, what is the approximate maximum load that can be applied to the shaft and the motor still start? What is this torque level commonly called?
From your predicted results, calculate the starting (locked-rotor) KVA per horse power. What NEMA starting letter designation would this motor receive?
What is the direction of flow of the imaginary component of stator current when the induction motor is loaded?