Referencing
Figures, Plots and Tables
Install Captioner
For the ability to reference figures and table in your text and to automatically number them we need to install an R package called captioner. Run the following command in the Rstudio console, or install using the “Tools/Install Packages…” from the main menu.
>install.packages("captioner")Here is the ‘How to’ for Captioner.
Create the Captions
Include the following R chunk. (probably at the beginning of your .Rmd file after the title block)
Code
```{r include = FALSE}

library(captioner)

fig_nums <- captioner(prefix = "Figure")

fig_nums("a fig", "caption for 'a fig'")
fig_nums("another fig", "caption for 'another fig'")
fig_nums("yet another", "caption for 'yet another'")
fig_nums("a_plot", "a R plot'")

table_nums <- captioner(prefix = "Table")

table_nums("a table", "caption for 'a table'")
table_nums("another table", "caption for 'another table'")
table_nums("yet another table", "caption for 'yet another table'")
```
Reference the Figures
Code
You can reference the figures like this:
`r fig_nums("a fig", display = "cite")`,
`r fig_nums("another fig", display = "cite")` and
`r fig_nums("yet another", display = "cite")`
Result
You can reference the figures like this: Figure 1, Figure 2 and Figure 3
Create the Figures and Link Captions
Code
{width="4in"}Result

Figure 1: caption for ‘a fig’
Code
{width="4in"}Result

Figure 2: caption for ‘another fig’
Code
{width="4in"}Result

Figure 3: caption for ‘yet another’
Reference the Tables
Code
You can reference the tables the same way you do the figures above like this:
`r table_nums("a table", display = "cite")`,
`r table_nums("another table", display = "cite")` and
`r table_nums("yet another table", display = "cite")`
Result
You can reference the tables the same way you do the figures above like this: Table 1, Table 2 and Table 3
Create the Tables and Link Captions
Markdown Table
Easily create a table here and copy and paste it over
Code
| Num | Header | Header2 | Header3 |
|:---:|--------|---------|---------|
|  1  | first  | 1st     | One     |
|  2  | second | 2nd     | Two     |
|  3  | third  | 3rd     | Three   |

Table: `r table_nums("a table")`
Result
| Num | Header | Header2 | Header3 |
|---|---|---|---|
| 1 | first | 1st | One |
| 2 | second | 2nd | Two |
| 3 | third | 3rd | Three |
Table with CSV and Kable
Recommended for Basic Tables - there is little customization here
Code
```{r, echo=FALSE, message=FALSE}
library(knitr)
library(readr)
kable_cap <- table_nums("another table")
a_table <- read_csv("./ref/a_file.csv")
kable(a_table, caption = kable_cap)
```
Result
| Measurement | Units | Description | Function/Device |
|---|---|---|---|
| Output Current | (A) | Drive Output Current | Powerflex 70 |
| Output Voltage | (V) | Drive Output Voltage | Powerflex 70 |
| Output Power | (kW) | Drive Output Power | Powerflex 70 |
| Output Powr Fctr | (-) | Drive Output Power Factor | Powerflex 70 |
| Speed | (rpm) | Shaft Speed | Pocket-tach |
| \(V_{ARM}^{DC}\) | \((V_{DC})\) | DC Component of the PMDC Machines Armature Voltage | Scope |
| \(I_{ARM}^{DC}\) | \((A_{DC})\) | DC Component of the PMDC Machines Armature Current | Scope |
Table using DT package
Recommended for Advanced Tables - Great for complex HTML tables
Need to install the DT package.
The R package DT provides an R interface to the JavaScript library DataTables. R data objects (matrices or data frames) can be displayed as tables on HTML pages, and DataTables provides filtering, pagination, sorting, and many other features in the tables.
Code
```{r, echo=FALSE, message=FALSE}
library(DT)
yat <- table_nums("yet another table")
datatable(iris,
    caption = yat)
```
Result
Reference the Plots
Code
You can reference the plots the same way you do the figures above like this:
`r fig_nums("a_plot", display = "cite")`,
Result
You can reference the plots the same way you do the figures above like this: Figure 4,
Create the Plots and Link Captions
Code
```{r, echo=FALSE, message=FALSE, fig.cap = plot_cap}
plot_cap <- fig_nums("a_plot")
t=seq(0,10,0.1)
y=sin(t)
z=cos(t)
plot(t, y, type="l", col="red", xlab="time", ylab="Sine wave")
lines(t, z, col="blue")
```
Result
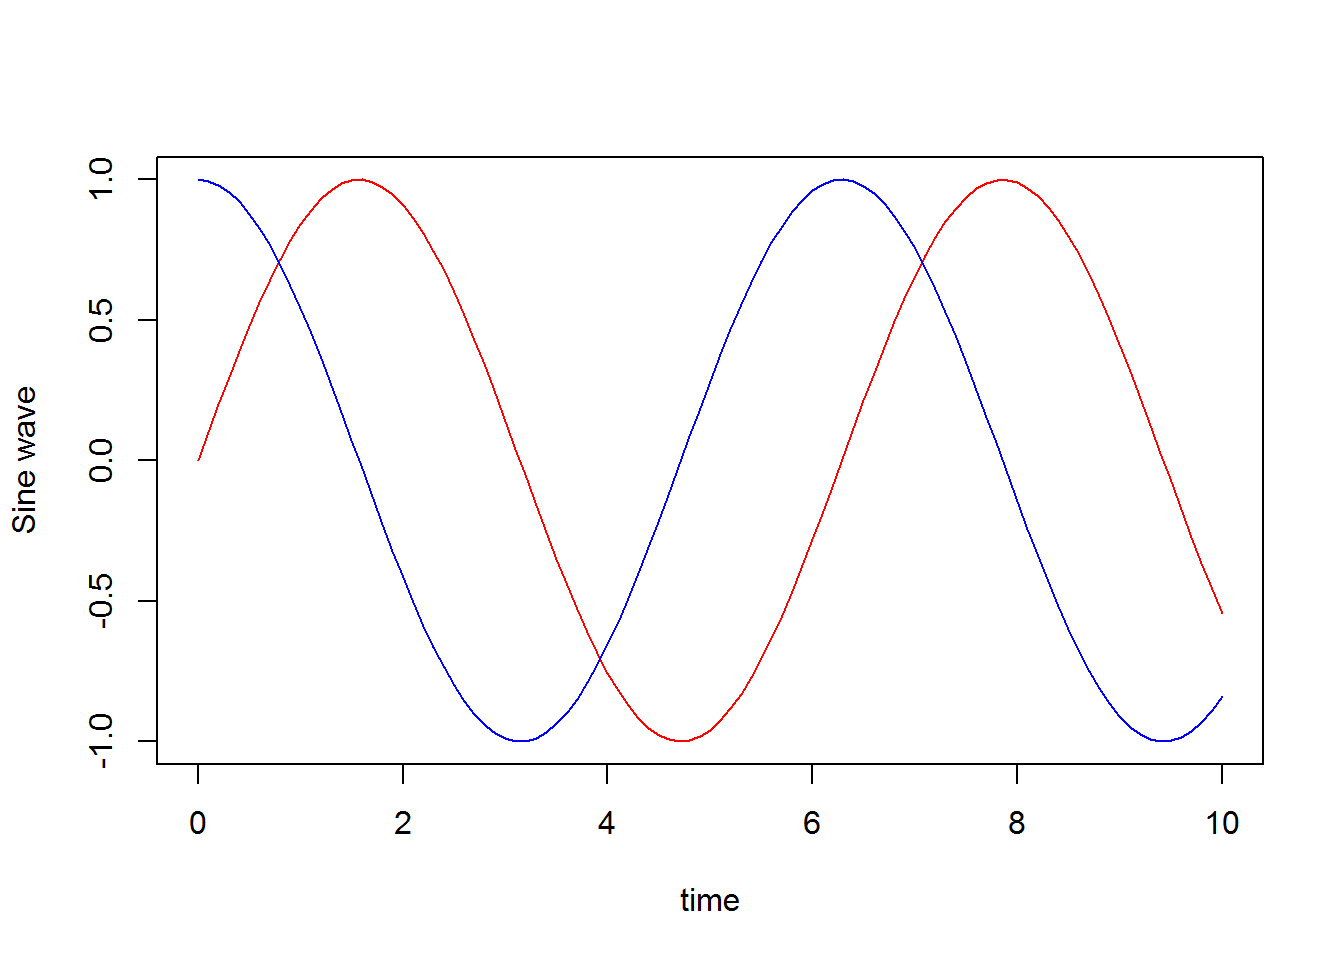
Figure 4: a R plot
Formulas
Here is how to reference Mathjax formulas. The idea is that you label the equation with an latex \label{} and then reference that label using \eqref{}. You need to either enable automatic Mathjax formula numbering or you can add a \tag{} to create a custom tag for the equation.
Reference the Equation
Code
In equation $\eqref{eq:sample}$, we find the value of an interesting integral:Result
In equation \(\eqref{eq:sample}\), we find the value of an interesting integral:
Create the Equation
Code
$$
\int_0^\infty \frac{x^3}{e^x-1}\,dx = \frac{\pi^4}{15}
\label{eq:sample}
\tag{3} % Optional, only if you are not using or want to override the automatic numbering.
$$
Result
\[ \int_0^\infty \frac{x^3}{e^x-1}\,dx = \frac{\pi^4}{15} \label{eq:sample} \tag{3} % Optional, only if you are not using or want to override the automatic numbering. \]