Oscilloscope
ECE202 - Electrical Circuits I
Electrical and Computer Engineering - University of Alberta
video 1. Oscilloscope

Figure 1: Tektronix TDS 1002 Oscilloscope
Helpful Links
Basic Features
Oscilloscopes are used to graph an electrical signal as it changes with time. voltage is on the vertical axis, and time is on the horizontal axis. There are many controls that can be used to adjust the graph and give the user the most reliable measurement possible. We will delve into some of those features below.
The Display
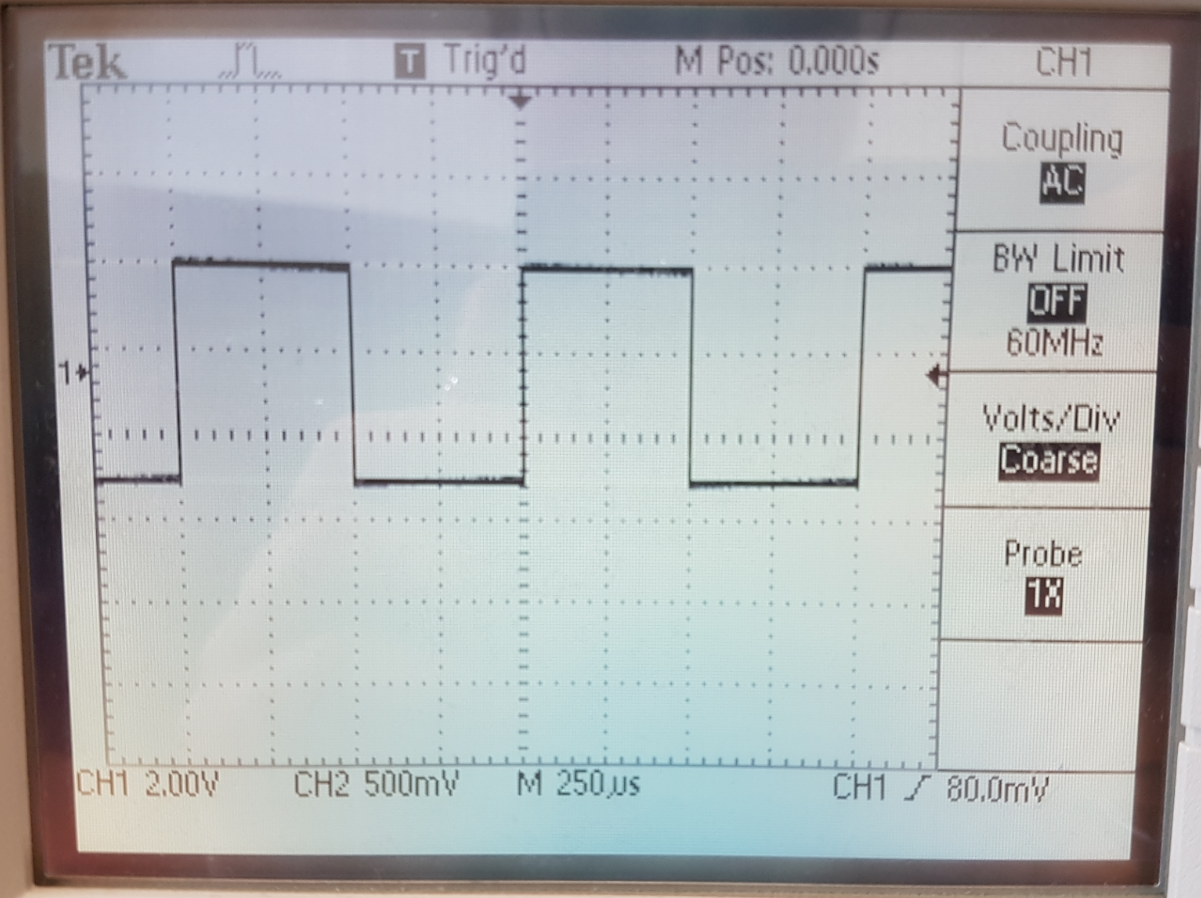
Figure 2: The Display
On the display of the oscilloscope, there is a grid that the signals will be overlaid on. This grid can be used to measure both the horizontal and vertical axes of the signals. As seen in the picture above, the size of each division (each square) on the grid is displayed at the bottom of the screen.
The first two numbers correspond to the size of each vertical division (in volts), with both channels being able to independently select a division size (in this case it is 2V/div for CH1 and 500mV/div for CH 2).
The third number represents the seconds per division, and this will be the same for both channels. In this case, each division corresponds to 250 microseconds.
The Channels
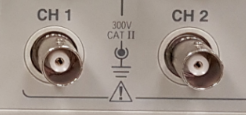
Figure 3: The Channels
These scopes come equipped with two channels each, however other scopes can have any number of channels that the design allows for. Each channel can view a signal independently from the other, and this can be used to compare two points in the circuit at once.
To see a signal on either channel (in other words turn the channel on), you must have the channel connected to the circuit via a probe, and you may have to press the button labeled CH 1 MENU if you are using channel 1, or CH 2 MENU if you are using channel 2.
In the channel menus, there are a few options that can be changed to affect the quality of the signals. Coupling can be chosen to be AC or DC, where DC coupling shows both AC & DC components of a signal, and AC coupling removes the DC component. These can each be useful in different situations.
The Volts/Div can be toggled between coarse and fine, changing how large the increases/decreases will be when turning the Volt/Div knob. Also the channels can be inverted (this is found in the MATH MENU on the TDS 210s).
Important: The ground terminals for each channel are internally connected, so when making measurements with both channels, you must make sure that the ground clips are at the same point in the circuit. Failure to do so will cause the circuit to be shorted. It is often useful to connect the probes of a channel opposite of how you want them to be oriented, and then using the MATH or CHANNEL menus to invert the channel.
Probes
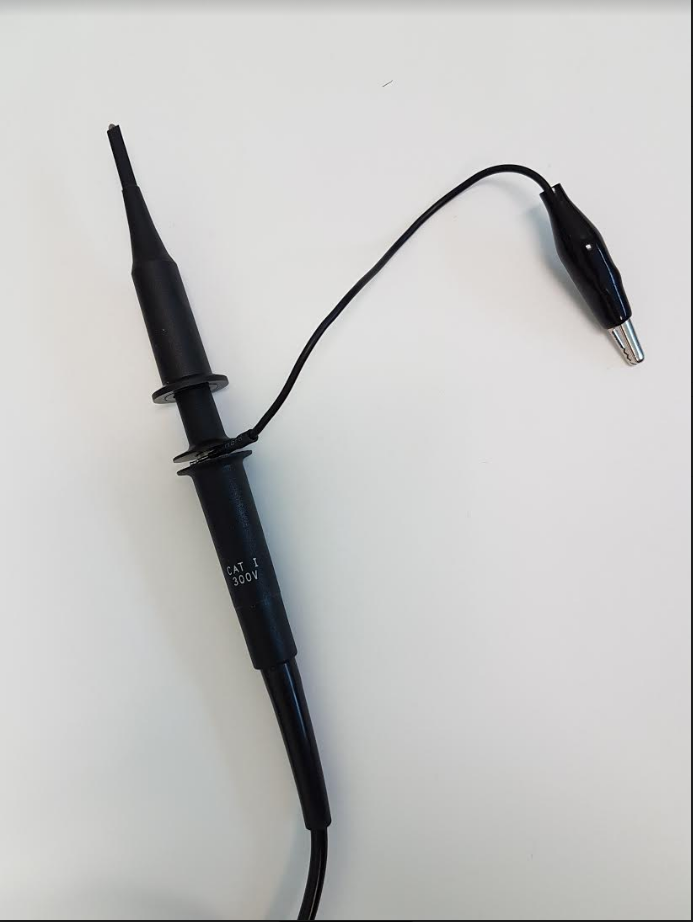
Figure 4: A Standard Probe
Probes are used to connect the oscilloscope to the circuit that is being measured. Standard oscilloscope probes consist of a sharp tip which can be hooked onto the circuit by sliding the plastic head back, and a ground clip which is used to shorten the distance between the tip and electrical ground.
To get precise measurements (as well as reduce capacitive loading), an attenuated probe is sometimes required. In our case, the probes in this lab have a switch to change between 1X and 10X mode (10X being the attenuated setting). For 10X probes, there is an internal series resistance such that it forms a voltage divider with the internal impedance of the scope at a ratio of 10:1. Our scopes have an option under the CH 1 and CH 2 menus to identify whether the probe is in the 1X or 10X mode. If you do not have this setting correct, your measurements will be off by a factor of 10.
If you look to the right of the channel terminals (to the left for the TDS 210), you should see two metal loops sticking out that are labelled “PROBE COMP”. These output a square wave of known voltage and frequency and can be used to test the probes. If you connect the tip of the probe to the upper metal piece, and the ground clip to the lower metal piece then turn on the channel, you should see a square wave being displayed. Adjustments can then be made to the scope settings to get the desired precision.
To be compatible with our printed circuit boards, we use banana cables as our oscilloscope probes. They are 1X probes.
Vertical Controls
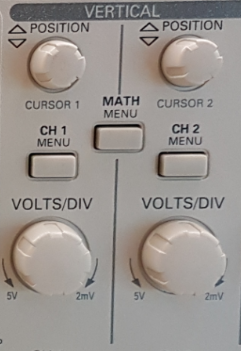
Figure 5: The Vertical Controls
The vertical controls consist of two knobs for each channel: a position knob and a VOLTS/DIV knob. The position knob can be used to move the signal up and down on the screen. The zero reference point (0V) can be identified by a small arrow on the left side of the screen with a number corresponding to the channel. This reference point will move with the signal as you turn the vertical position knob.
The VOLTS/DIV (volts per division) knob can be used to change the vertical scaling factor of the grid. To increase the amount of volts per division, turn the knob counterclockwise and the signal on screen should appear to shrink. To decrease the amount of volts per division, turn the knob clockwise and the signal should appear to grow.
Horizontal Controls
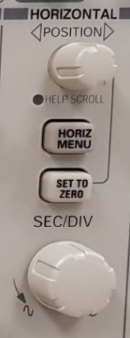
Figure 6: The Horizontal Controls
The horizontal controls also consist of two knobs, but unlike the vertical controls these will affect both channels at once. The position knob can be used to scroll the signals from left to right, allowing the user to see earlier or later segments.
The SEC/DIV (seconds per division) knob can be used to change the horizontal scaling factor of the grid. To increase the amount of seconds per division, turn the knob counterclockwise and the signal should appear to compress. To decrease the amount of seconds per divison, turn the knob clockwise and the signal should appear to stretch.
Triggering
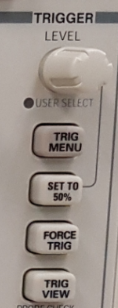
Figure 7: The Trigger Controls
Oscilloscopes collect data about a signal by performing many sweeps per second, if each sweep began on a different part of the sgnal the waveform on the display would be a mess. This is where triggering is needed. The trigger tells the scope what parts of the signal to start measuring on, and in the case of periodic signals, this allows for a static waveform to be displayed. Without proper triggering, the waveform will be very jittery and nearly impossible to make a measurement from.
There are different types of triggering that can be done, but for simplicity we will stick to edge triggering. In the trigger menu you will see that there are multiple options available, allowing you to choose the trigger source and the slope type, as well as a few other options. For our purposes, we will always use the channel that we are measuring as the source, but in more complex cases other channels or even external sources can be used.
With edge triggering and the correct channel selected, the trigger can be chosen to occur on a rising slope or a falling slope. This means that when the signal has a rising/falling slope, it triggers the oscilloscope to start recording.
The trigger level knob can be used to adjust the trigger level. This level is identified by the arrow on the right side of the grid. If this arrow is outside of the highest or lowest points in the signal, it will not be able to detect a trigger point.
By looking at the arrow at the top of the grid, the user can identify where on the waveform the scope is triggering.
Measurements
Measurements of voltage and time can be made by counting out the number of divisions and then multiplying by the division scale, but there are also two other methods of making measurements on these scopes.
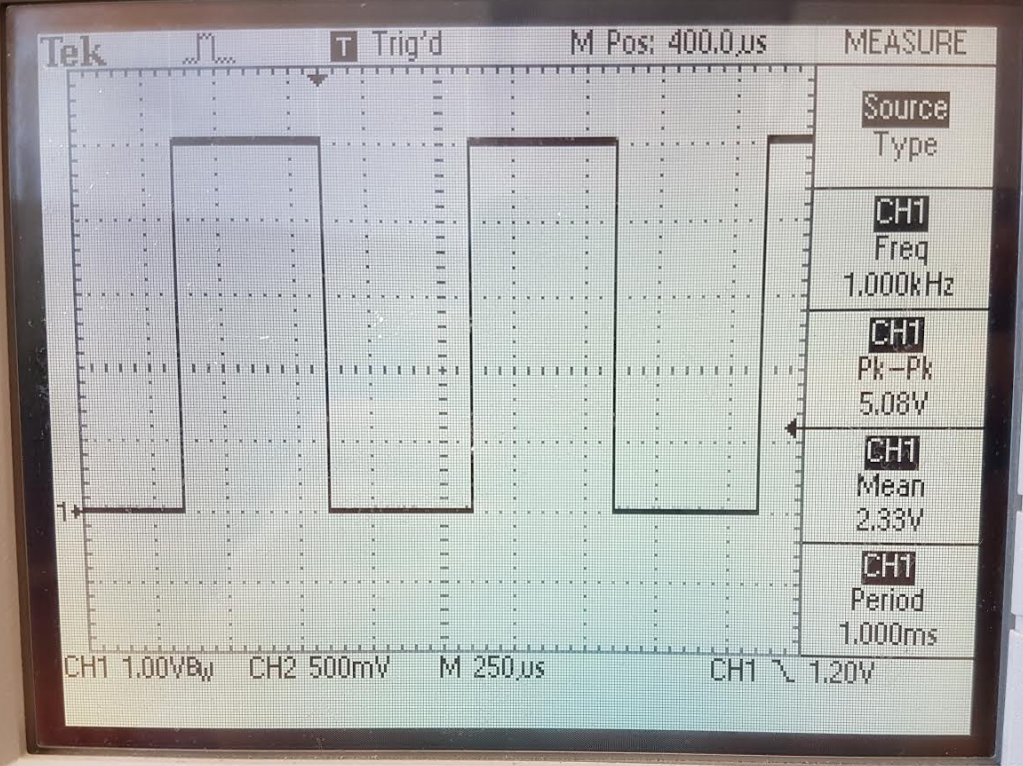
Figure 8: Using the MEASURE Button
By pressing the MEASURE button, you will be able to see four different measurements of your signals. By toggling between “Source” and “Type”, you can select which channel you want to measure, as well as what type of measurement you want to see. This allows you to get a value for frequency, period, mean voltage, peak-to-peak voltage, and more.
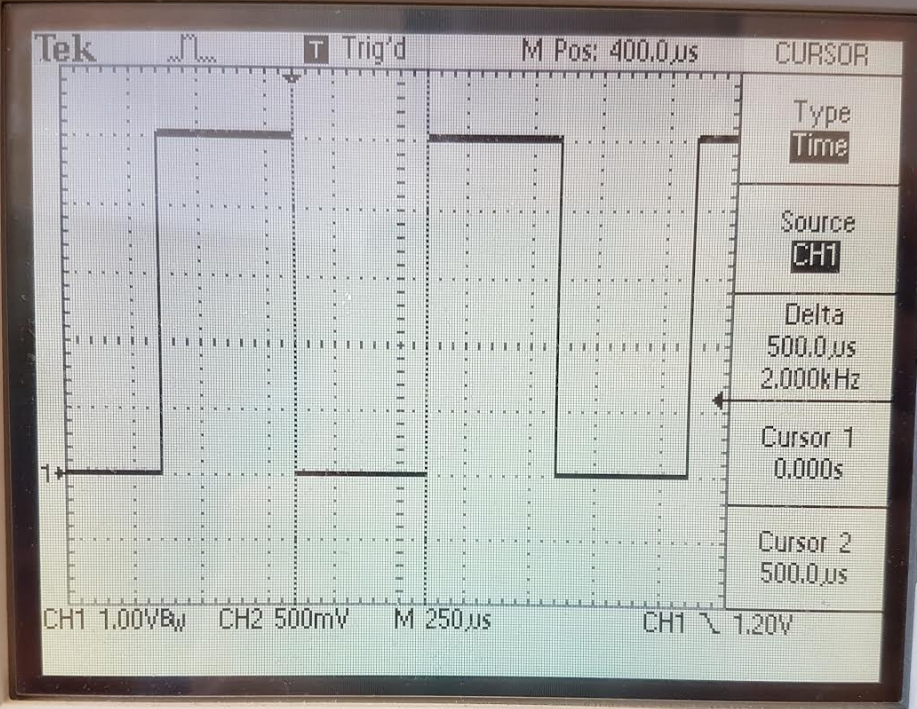
Figure 9: Using the CURSOR Button
The third method is done by pressing the CURSOR button. After selecting the type of cursors (“Voltage” for horizontal, “Time” for vertical), you can use the two vertical position knobs to move the cursors. Position your cursors on the ends of the voltage or time you want to measure, and then take the reading from the “Delta” heading.
Other Functions
Using the MATH MENU button, you can add and subtract signals from channels 1 and 2 with the result being displayed on the grid.
Other useful buttons include the AUTOSET button, which makes the scope attempt to set the division sizes such that you can see a few waveforms of the signal, and the RUN/STOP button, which can be used to freeze a single sample of the waveform on the display. This may be used when the user is dealing with signals that cannot be easily triggered.