Lab 1: Familiarization and Safety
ECE330 - Introduction to Power Engineering
Electrical and Computer Engineering - University of Alberta
1 Introduction
The goals for this laboratory are for you to learn how to connect circuits, use the measurement instrumentation and become familiar with some of the equipment used in the lab, specifically the power supply and the data acquisition system. This lab has 4 rather simple circuits that you should already be comfortable with on how they operate from previous courses. The experimental circuits are as follows:
- Circuit 1: A Power Supply Output Voltage Measurement Circuit
- Circuit 2: A Simple DC Circuit with a Resistive Load
- Circuit 3: A Simple AC Circuit with a RLC Load
- Circuit 4: A Simple Wye Connected Three-phase circuit with a RL Load
1.1 Pre-lab
Familiarize yourself with the Safety Rules as well as the Equipment and Software used in the first Laboratory by viewing the information on the laboratory webpage below:
https://sites.google.com/ualberta.ca/ece330-introtopowerengineering/home
Note the equipment datasheets can be located at the bottom each page.
To access the webpage, you need to be logged-in with your CCID.
If you cannot access the webpage contact: terheide@ualberta.ca
Watch the General Lab Safety Video .
Review simple AC 1-ph and 3ph passive circuit analysis including formulas, waveforms and phasors.
Have at least the ECE330 - Lab 1 – Results Sheets printed off before coming to the lab.
1.1.1 Pre-lab Questions
The information for questions 1-4 can be found either in this manual or on the webpage and datasheets mentioned above. Answer the questions on a separate piece of paper to be handed-in at the beginning of your schedule lab session (Show all of your work). Make sure to clearly put your name, student ID number, CCID and your lab section at the top of the page.
The main power supply (Model 8525) has 4 different main “POWER” outputs. What are the 4 outputs? What are each of the outputs voltage and current ratings? How is each output controlled?
LVDAC-EMS has is a software package that controls the Data Acquisition and Control Interface, What are the 3 virtual instruments you will be using in lab 1? Give a brief description of each instrument.
What do the virtual instrument use as inputs? What are the ratings of these inputs?
Draw and describe how the Resistive Load (Model 8311) is configured; label the voltage, current and nominal power rating of the 3 different values of resistor used in the Resistive Load? What is the maximum total power capability if all 9 of the load resistors are put in parallel?
Make the following calculations for the circuit below. (answers should be in polar form, relative to the supply voltage)
What is the total impedance of the RLC load on the AC Supply?
Calculate the supply current?
Calculate the voltage across and current though each component (R, L and C)?
What is the total magnitude of the Real, Reactive and Apparent Power drawn from the supply?
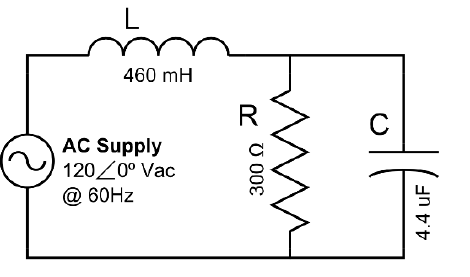
Figure 1. Pre-lab circuit
1.2 Equipment Required
List of Equipment used for this Laboratory Experiment.
- Power Supply – Model 8525-20
- Resistance Load – Model 8311-00
- Inductive Load – Model 8321-00
- Capacitive Load – Model 8331-00
- Safety banana Leads – 3 Colors, 3 Lengths
- Data Acquisition and Control Interface (DACI) – Model 9063
- Accessories – (USB cable, Barrel Power Cable)
- Computer running LVDAC-EMS software
2 Experimental Procedure
2.1 Launch LVDAC-EMS
Login to the computer at your station. Use your CCID and password.
Connect the provided Barrel power cable from the “24V – 3A – AC” accessories output on the power supply to the “power input” on Data Acquisition and Control Interface (DACI).
Connect the provided USB cable from the DACI’s “Computer I/O” port to a free USB port on the computer.
Turn ON the accessories power supply “24V – 3A – AC” and make sure the green LED is lit on the DACI next to the “power input”.
Launch the LVDAC-EMS software located on the desktop.

Figure 2. Computer icon
You should be greeted with the following screen.
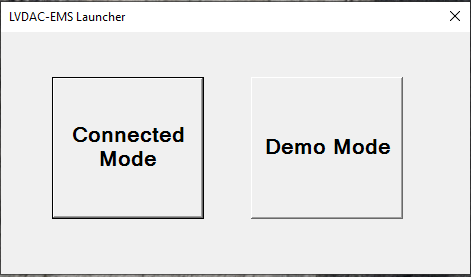
Figure 3. Mode selection
Select “Connected Mode” to connect the software to the physical DACI hardware.
Make sure your device is found it should show Model 9063 and a Serial Number.

Figure 4. Serial number
Select
 for our systems
voltage and frequency .
for our systems
voltage and frequency .Click “OK” to continue launching the software.
You should now have the LVDAC-EMS software running.
Take a minute to familiarize yourself with the interface.
If you have ever have any questions about the software the help files can answer a lot of your questions.
2.2 Power Supplies
The purpose of this first circuit is to make it clear on how to connect, how to control and how to monitor the outputs of the main power supply (Model 8525). You will also be learn how to connect, launch and configure the Metering instrument of the DACI to measure the power supply voltage outputs.
2.2.1 Circuit Setup
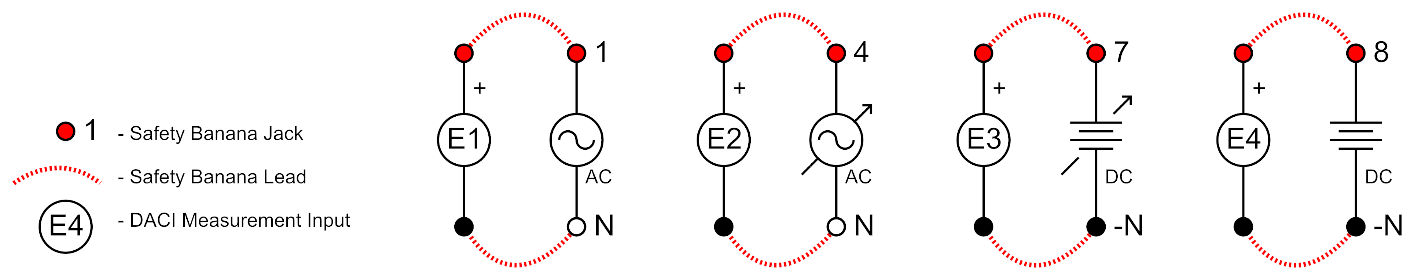
The four main power supplies are as follows:
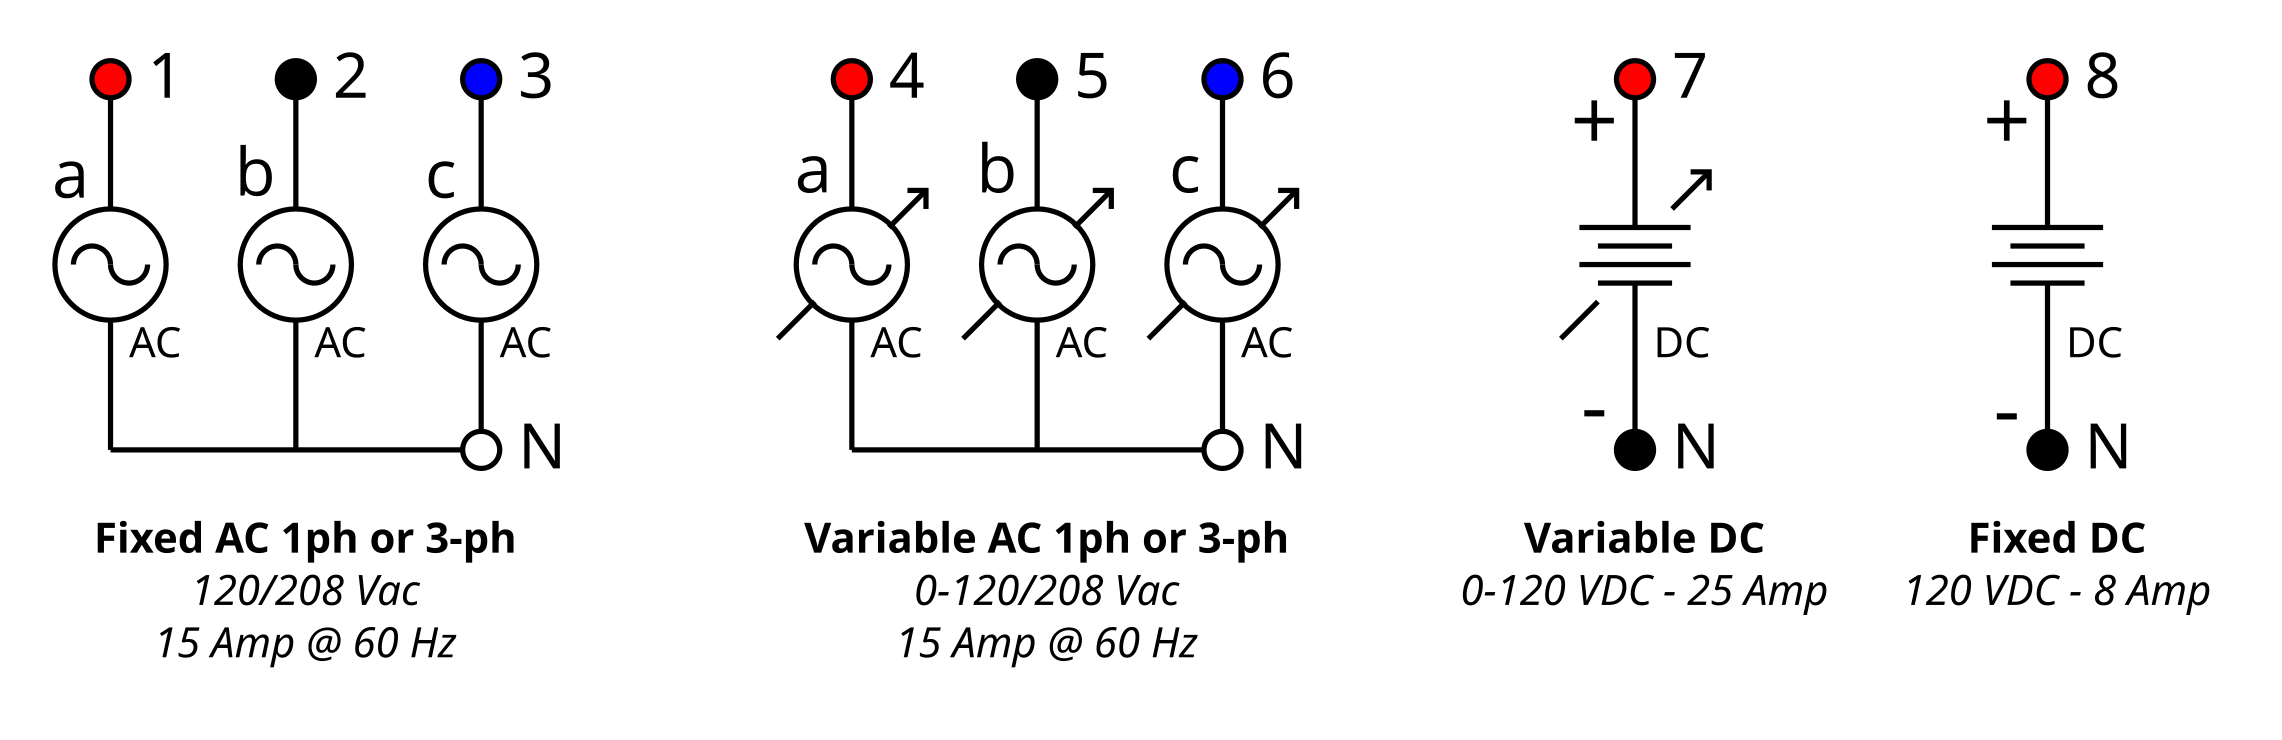
Figure 5. The four power supplies available on the DACI
All 4 power supplies above are controlled by a single switch on the power supply labelled POWER with 0 being OFF and 1 being ON.
The variable supplies are controlled by the large variac knob on the front panel of the power supply, the variac scale goes from 0 – 100% of the input voltage, which are the fixed supplies.
The 3-phase supplies can be used as a single phase supply by simply using any phase to neutral (120Vac,rms) or any phase to phase (208Vac,rms).
All phases A, B or C are available via terminals 1, 2 or 3 for the Fixed AC supply or terminals 4, 5 or 6 for the variable supply. The three phase supplies also have the neutral/star point available at terminal N.
The main voltage and current inputs into the Data Acquisition and Control interface are as follows:
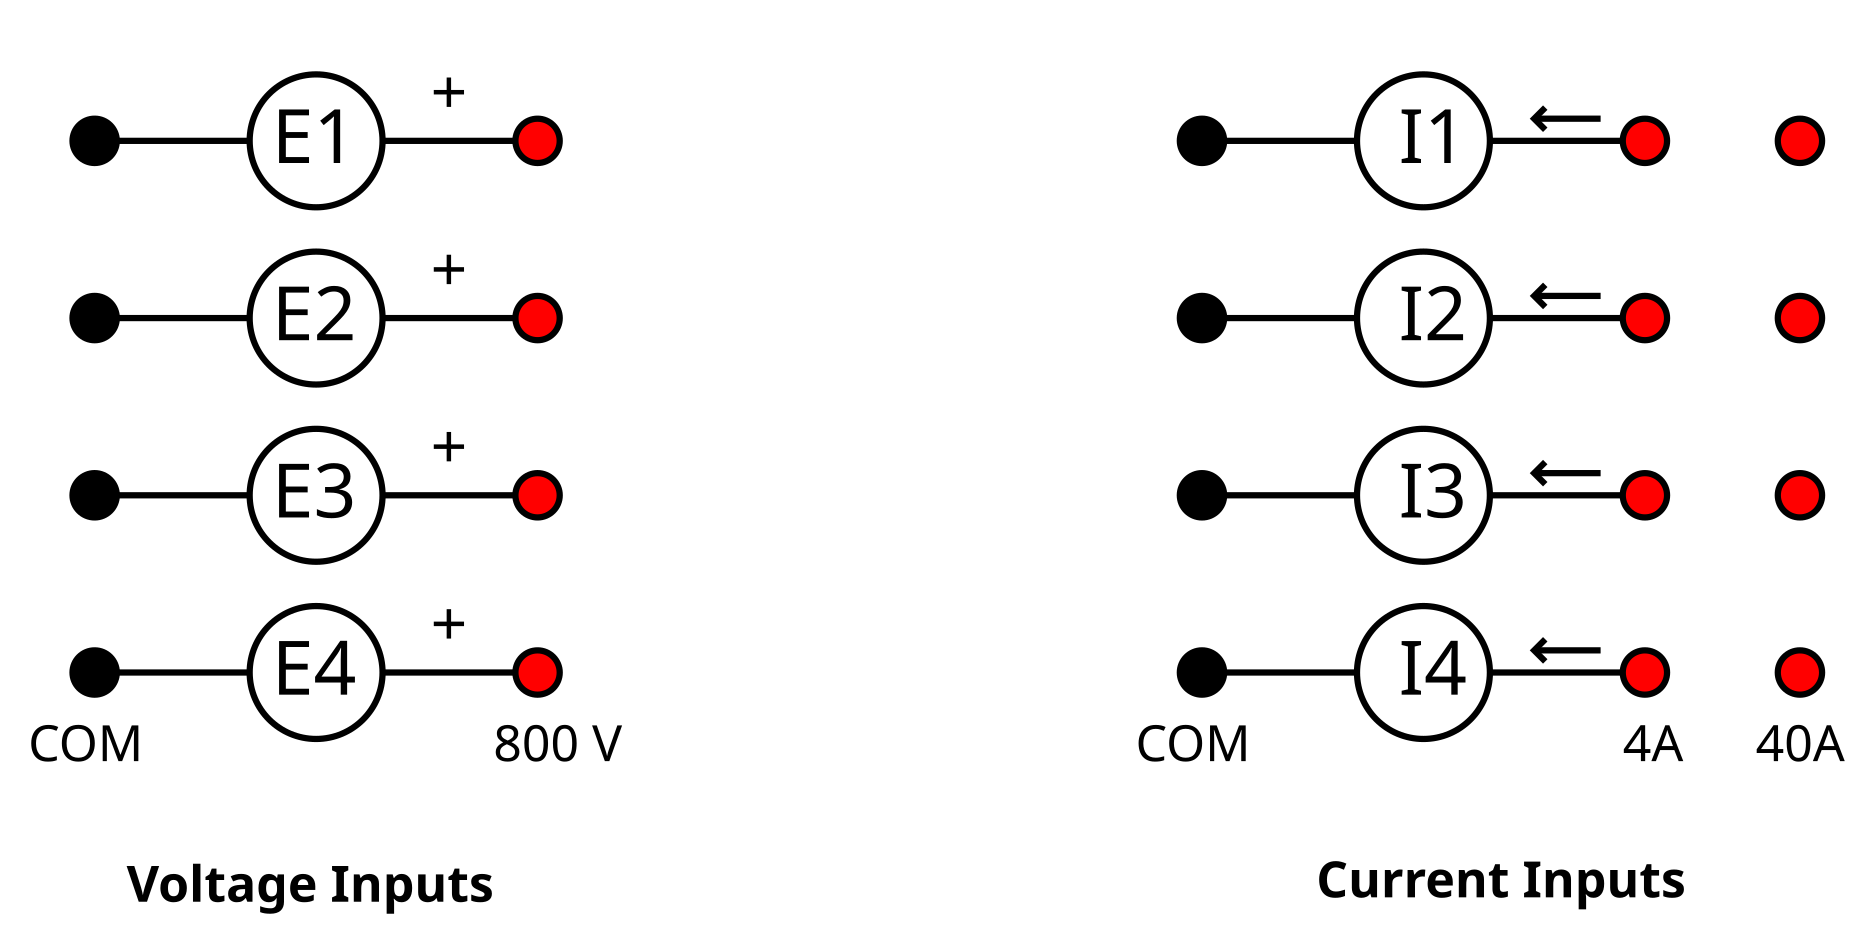
Figure 6. DACI inputs
There are 4 Voltage and 4 Current high power isolated inputs available on the DACI.
There are 2 scales for each input, the voltage scales happen automatically in software and you don’t have to worry about it, they are 80V and 800V. The current scales are done with external connections and you can use either the 4 Amp or 40 Amp scale. These current represent the maximum input current for each scale.
Notes on wiring up circuits.
When making any changes to any of your circuits always make sure that the main power supply is “OFF”.
Always wire the higher current carrying part of the circuit first, then add things like voltage measurements last.
Don’t stack the safety banana leads more than necessary, never stack more than 3 high.
When wiring watch for short circuits, this usually is the most destructive wiring mistake.
When wiring also pull and push the safety banana leads in and out of jacks using the solid connector part and not by pulling on wire.
Connect the circuit shown in Circuit 1.
- Connect each available power supply to its corresponding voltage input on the DACI as show in Circuit 1.
Circuit 1. Voltage Measurements
2.2.2 Instrument Setup
Click on the Metering button
 to bring up Metering
Instrument.
to bring up Metering
Instrument.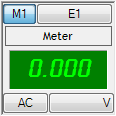
Figure 7. A single meter instrument
Configure the first 4 Meters (M1, M2, M3 and M4) as shown in the table below.
| Meter | Description | Type | Input / Function | Mode |
|---|---|---|---|---|
| M1 | Fixed AC Voltage | Voltage | E1 | AC |
| M2 | Adjustable AC Voltage | Voltage | E2 | AC |
| M3 | Adjustable DC Voltage | Voltage | E3 | DC |
| M4 | Fixed DC Voltage | Voltage | E4 | DC |
Using the LVDAQ-EMS Help, read about the Modes that can be used for measuring voltage and current in the article “Technical Information about the Voltmeters and Ammeters”.
Change the layout: 4 Columns and 1 row. So only the active Displays are shown, you can do this by going to View/Layout and changing things accordingly.
Before applying power to your circuits it’s always good practice to start with the variac turned to 0% and to have all loads turned a minimum.
2.2.3 Results
When you think your circuit and instrumentation is set up correctly get an instructor or TA to verify it before you apply power.
Apply power by using the main power switch, L1, L2 and L3 should light up to indicate power.
Notice that 4 Metering Displays all still show 0. The display isn’t updated until you press the refresh button. Press the “single refresh” button
 . Notice that the
displays are updated with new values but not continually
updated.
. Notice that the
displays are updated with new values but not continually
updated.Press the “continuous refresh” button
 and make sure
the Metering window is doing so.
and make sure
the Metering window is doing so.Increase the variac on the power supply slowly while watching the metering window. Notice how the voltages of adjustable supplies begin to increase from ~0V and the fixed supplies don’t change.
Notice that you can also measure the output voltages (variable AC, variable DC and Fixed DC) with the analog meter that is built into the power supply. The voltage meter selector knob to the right of the analog meter, controls which output voltage the analog meter displays. Go ahead and try a few knob positions for various variac settings.
Record the Voltage from the Metering instrument at variac setting of (0%, 30%, 60%, 90% and 100%) in the appropriate table of the results section.
Return the variac to 0% and turn-off the main power supply. With the main power supply off disconnect circuit 1.
2.3 DC Measurements
For circuit 2 you will continue building on the principles you have acquired from the first circuit. You now experiment with a circuit that carries DC current using the variable DC supply as the source, this will require you to use the current input of the DACI to make current measurements; Therefore power can all be displayed.
2.3.1 Circuit Setup
Connect the circuit shown in Circuit 2. (Double Check that the Main Power Supply is “OFF”)
Use the variable DC supply.
Use E1 and I1 (4A) inputs on the DACI to measure the voltage across and current through the load, respectively.
Use a single set of resistors (3 switches) from the Resistive Load.
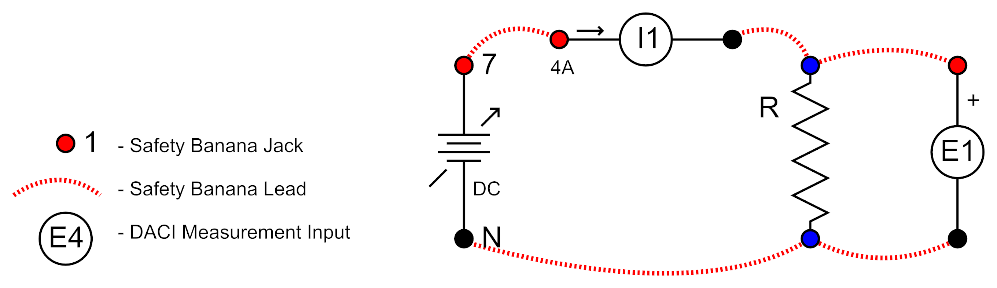
Circuit 2. DC Measurements
WARNING: Double Check that you have connected the Resistive Load and not the Inductive Load, using the Inductive load on a DC circuit will cause damage to the equipment by essentially causing a short circuit of the supply. Recall, the dc impedance of an inductor is ideally zero!
2.3.2 Instrument Setup
- Set up the Metering Instrument as follows:
| Meter | Description | Type | Input/ Function | Mode |
|---|---|---|---|---|
| M1 | Voltage across Resistor | Voltage | E1 | DC |
| M2 | Current through Resistor | Current | I1 | DC |
| M3 | Power in Resistor | Power | PQS1 (E1,I1) | P |
| M4 | DC Load Resistance | Impedance | RDC (E1, I1) | R |
2.3.3 Results
When you think your circuit and instrumentation is set up correctly get an instructor or TA to verify it before you apply power.
Apply power by using the main power switch, L1, L2 and L3 should light up to indicate power.
Use the selector Knob to select 7-N DC to monitor that voltage on the analog display.
Increase the variac until the voltage on the analog meter shows ~100VDC.
Go through the 8 switching states in Table 3 below and record the displays of the metering instrument in the appropriate table of the results section.
- The Resistive Load is made up of 3 separate banks and each bank is controlled by 3 switches. In this circuit we are only using a single bank. With all of the switches down (OFF) the circuit is an open circuit or infinite resistance. Turning a single switch to the up (ON) position will put the associated resistor in the circuit, either 1200, 600 or 300 Ohms. Turning a second switch ON will put that associated resistor in parallel with the first decreasing the overall resistance and so on. A zero (0) means the switch is off and the resistance is open. A one (1) means the switch is on and the resistor is in the circuit.
| 1200 Ω | 600 Ω | 300 Ω | Total Resistance |
|---|---|---|---|
| 0 | 0 | 0 | Open |
| 1 | 0 | 0 | 1200 Ω |
| 0 | 1 | 0 | 600 Ω |
| 1 | 1 | 0 | 400 Ω |
| 0 | 0 | 1 | 300 Ω |
| 1 | 0 | 1 | 240 Ω |
| 0 | 1 | 1 | 200 Ω |
| 1 | 1 | 1 | 171 Ω |
2.3.4 Data Table Setup
Click on the data table button
 to bring up the
data table. The data table can be used to store data from any one of the
instruments that is currently running.
to bring up the
data table. The data table can be used to store data from any one of the
instruments that is currently running.Configure the data table to record the same 4 outputs that you used for the metering instrument.
Click on the Record settings button
 . With the Record
settings window open, under settings, “Metering” should be the only
thing selectable because it is the only instrument currently
running.
. With the Record
settings window open, under settings, “Metering” should be the only
thing selectable because it is the only instrument currently
running.Make sure meters M1-M4 are the only ones selected.
Now hit OK to exit out of record settings.
Now simply by hitting the record data button
 , the current
values that are displayed on the Meters are recorded on a new line in
the data table.
, the current
values that are displayed on the Meters are recorded on a new line in
the data table.Try changing your circuit by adjusting either the variac or the load box and recording a few lines in the data table.
To clear the data table, click the clear data table button
 .
.
Redo the experiment above with the variac set to 100%, by using the data table to record your results instead of manually writing them down. With all 8 switch states in order recorded in a single file export your results to a .csv file.
Import your .csv file into Excel so it is formatted properly with each data value contained in a single cell in the appropriate row and column.
Get an instructor or TA to view your data file and sign off on your results sheet.
Return the variac to 0%, turn OFF all of the Resistive load switches and turn-off the main power supply. With the main power supply off, disconnect circuit 2.
2.4 AC Measurements
The purpose of circuit 3 is to continue learning how to connect the equipment and to use DACI to wire and make measurements in an AC circuit.
2.4.1 Circuit Setup
Connect the circuit shown in Circuit 3. (Double Check that the Main Power Supply is off)
Connect a single-phase of the fixed ac supply to a single bank of each type of load (R, L and C) connected in parallel.
Make sure to connect input I1 (4A) from the DACI in series with the voltage output.
Also connect the DACI voltage input E1 across the parallel connected load.
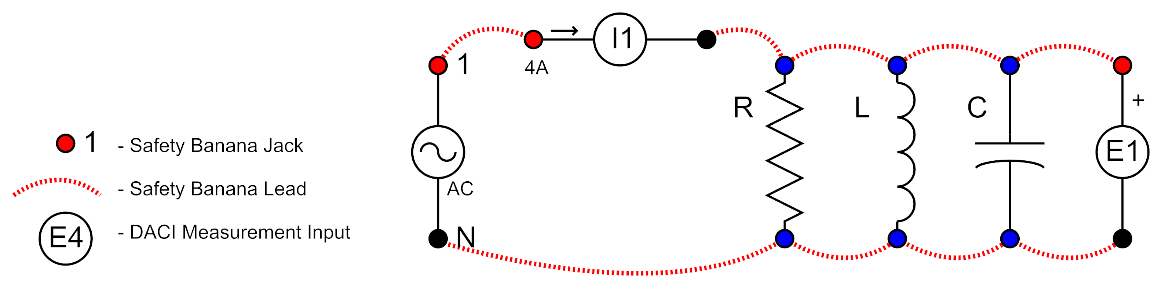
Circuit 3. AC Measurements
2.4.2 Instrument Setup
- Set up the Metering Instrument as follows in Table 4:
| Meter | Description | Type | Input / Function | Other |
|---|---|---|---|---|
| M1 | Phase Voltage | Voltage | E1 | AC |
| M2 | Phase Current | Current | I1 | AC |
| M3 | System frequency | Frequency | f (E1) | Hz |
| M7 | Real Power | Power | PQS1 (E1,I1) | P |
| M8 | Reactive Power | Power | PQS1 (E1,I1) | Q |
| M9 | Apparent Power | Power | PQS1 (E1,I1) | S |
| M13 | Power Factor | Power Factor | PF (E1,I1) | True |
| M14 | Current Phase Shift (relative to the voltage) | Phase Shift | PS (E1,I1) | |
| M15 | Load Impedance | Impedance | RXZ// (E1, I1) | Z |
Oscilloscope Setup:
Click on the Oscilloscope button
 on the toolbar.
This will launch the Oscilloscope Instrument.
on the toolbar.
This will launch the Oscilloscope Instrument.Configure channel 1 and 2 as shown in Figure 8 below.
Click on the Continuous Refresh Button to update the Oscilloscope display.
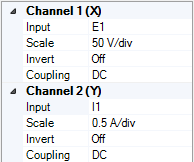
Figure 8. Oscilloscope Setup
Phasor Analyzer Setup:
Click on the Phasor Analyzer button
 on the toolbar.
This will launch the Phasor Analyzer Instrument.
on the toolbar.
This will launch the Phasor Analyzer Instrument.Configure channels as shown in Figure 9 below.
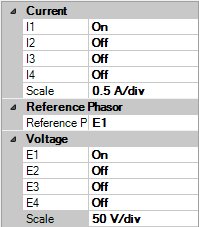
Figure 9. Phasor Analyzer Setup
- Click on the Continuous Refresh Button to update the Phasor Analyzer display.
2.4.3 Results
When you think your circuit and instrumentation is set up correctly get an instructor or TA to verify it before you apply power.
Apply power by using the Main power switch, L1, L2 and L3 should light up to indicate power.
Verify and understand circuit operation using the instruments you set up by going through the switch states as listed in Table 5. Note that a one in the table means to turn on all 3 of the load switches in the appropriate bank. A zero means to turn all 3 switches off.
| R | L | C | Load |
|---|---|---|---|
| 1 | 0 | 0 | R |
| 1 | 1 | 0 | RL |
| 1 | 0 | 1 | RC |
| 1 | 1 | 1 | RLC |
| 0 | 1 | 0 | L |
| 0 | 0 | 1 | C |
For the Load states: R, RC and L in Table 5 complete the appropriate table, oscilloscope chart and phasor diagram located in the Results section.
- Fill the table with the values from the Metering instrument.
Draw the phase current relative to the given phase voltage waveform using the Oscilloscope instrument. (Draw approximate fundamental frequency current (ie. 60Hz) only, Don’t worry about noise/harmonics)
Draw the phase current phasor relative to the given phase voltage phasor using the Phasor Analyzer instrument.
Turn OFF all the load switches and turn-off the main power supply. Get an instructor or TA to view your results and sign off on your results sheet. With the main power supply off disconnect circuit 3.
2.5 Measuring Phase (3Ph)
The purpose of circuits 4a and 4b is to continue learning how to wire the equipment properly in the more complicated three-phase configuration as well as use the DACI (Data Acquisition and Control Interface) and LVDAC-EMS software to make three-phase measurements.
2.5.1 Circuit Setup (4a)
Connect the circuit shown in Circuit 4a. (Double Check that the Main Power Supply is off).
Connect the variable 3-phase supply to a wye connected RL Load as shown below.
Use the I1, I2 and I3 (4A) of the DACI to measure the red, black and blue phase supply currents respectively.
Use the E1, E2, and E3 of the DACI to measure the red, black and blue voltages across the RL loads respectively.
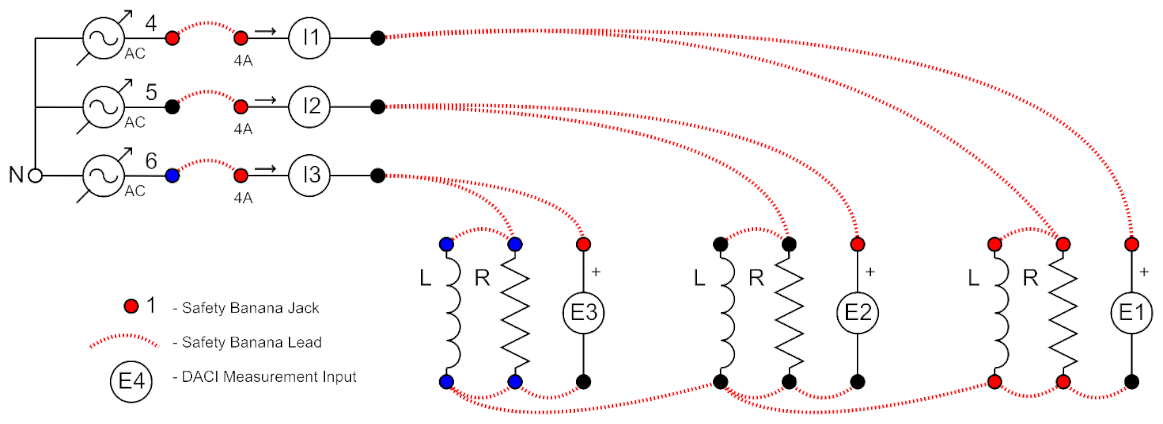
Circuit 4a. Three-phase Measurements
2.5.2 Instrument Setup (4a)
- Set up the Metering Instrument as follows in Table 6. (Use 6 column, 3 row Metering layout)
| Meter | Description | Type | Input / Function | Other |
|---|---|---|---|---|
| M1 | Phase A Voltage | Voltage | E1 | AC |
| M2 | Phase B Voltage | Voltage | E2 | AC |
| M3 | Phase C Voltage | Voltage | E3 | AC |
| M4 | Frequency of Phase A | Frequency | F(E1) | Hz |
| M5 | 3Ph Power Factor | Power Factor | PF(EI1,EI2,EI3) | True |
| M6 | Phase Shift between voltage and current | Phase Shift | PS(E1,I1) | |
| M7 | Phase A Current | Current | I1 | AC |
| M8 | Phase B Current | Current | I2 | AC |
| M9 | Phase C Current | Current | I3 | AC |
| M10 | 3ph Real Power (sum of phases) | Power | PQS1+PQS2+PQS3 | P |
| M11 | 3ph Reactive Power (sum of phases) | Power | PQS1+PQS2+PQS3 | Q |
| M12 | 3ph Apparent Power (sum of phases) | Power | PQS1+PQS2+PQS3 | S |
| M13 | Phase A Real Power | Power | PQS1(E1,I1) | P |
| M14 | Phase B Real Power | Power | PQS2(E2,I2) | P |
| M15 | Phase C Real Power | Power | PQS3(E3,I3) | P |
Using the LVDAQ-EMS Help, Read about how the software calculates Power for different circuit connection in the article “Technical Information about the Electrical and Mechanical Power Functions”.
Oscilloscope Setup:
Channel 1, 2 and 3 as E1, E2 and E3 respectively, Set these scales as 50 V/div.
Channel 5, 6 and 7 as I1, I2 and I3 respectively, Set these scales as 0.5 A/div.
Leave Invert off and Coupling as DC.
Phasor Analyzer Setup:
Turn on I1, I2, and I3 and use a scale of 0.5 A/div.
E1 should be your reference.
Turn on E1, E2, and E3 and use a scale of 50 V/div.
2.5.3 Results (Circuit 4a)
When you think your circuit and instrumentation is set up correctly get an instructor or TA to verify it before you apply power.
Apply power by using the Main power switch, L1, L2 and L3 should light up to indicate power.
Increase the variac slowly to 75%.
Verify and understand circuit operation using the instruments you set up by going through a few of the balanced (equal number of switches for each phase) R, L and RL load states.
2.5.3.1 R Load (4a)
Turn on the Resistive load by switching ON all 9 (3 for each bank) of the switches. Make sure that all of the switches on the Inductive load remain off.
In the Results section draw the remaining 2 phase voltages and the I1 current relative the E1 voltage which is given.
Complete the phasor diagram provide in the Results section with the remaining 2 phase voltages and 3 phase currents relative to the E1 phasor that is given.
Complete the R Load column from the Metering Instrument in the Results section.
Return the variac to 0%, turn OFF all the load switches and turn-off the main power supply. Leave Circuit 4a connected as you will only make a few modifications in the next section.
2.6 Measuring Line-to-Line (3Ph)
2.6.1 Circuit Setup (4b)
Make the following circuit changes to obtain the circuit shown in Circuit 4b. (Double Check that the Main Power Supply is off).
Disconnect E1, E2 and E3 and reconnect them to measure the 3 line-line voltages VAB, VBC and VCA respectively. In the figure, E1, E2, and E3 don’t use lines to connect them but use labels instead. Connect A-A and B-B etc…
Connect E4 to measure the phase voltage of phase A (the red phase), you will use this as a reference so you can compare the phases of Circuit 4a to those in Circuit 4b.
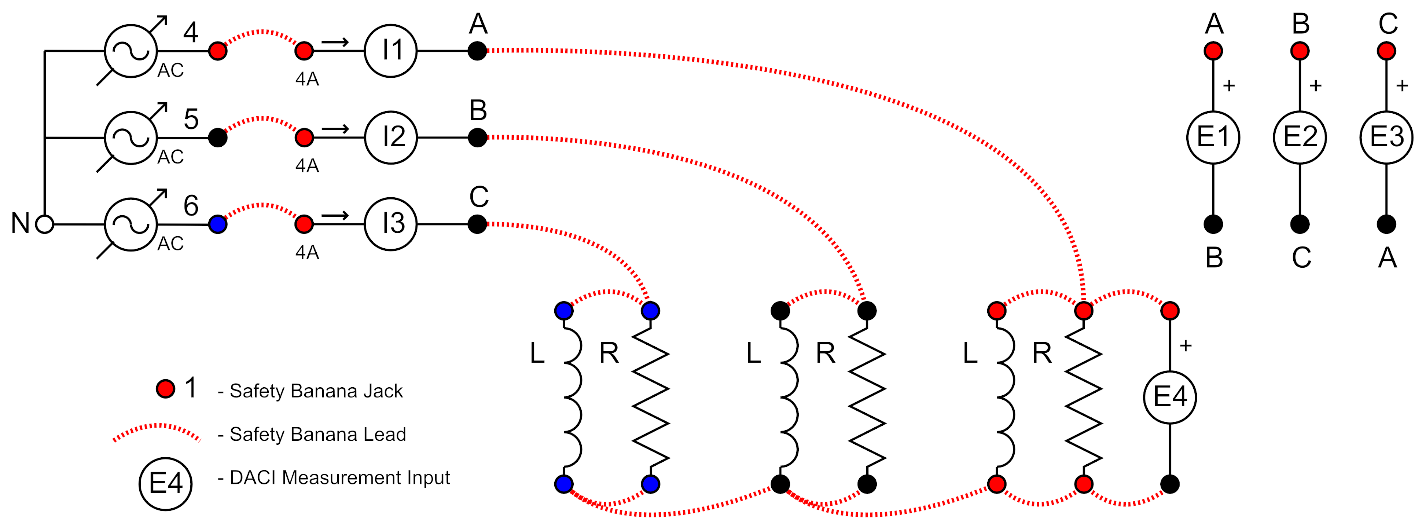
Circuit 4b. Line-line 3-ph Measurements
2.6.2 Instrument Setup (4b)
Make the following changes from the instrument set up from Circuit 4a:
Metering Setup:
Change M4 to measure Voltage on E4.
M5 will continue to measure PF but you’ll need to change the function to PF (E1, I1) 3~.
M10, M11 and 12 will continue to measure P, Q and S but the function needs to change to PQS1 (E1,I1) 3~.
The Remaining meters M13, M14 and M15 can be disabled.
Oscilloscope Setup:
- Add Channel 4 as E4.
Make Channel 4 the source trigger channel.
Adjust the scales if necessary.
Phasor Analyzer Setup:
Turn on E4.
Make E4 your reference phasor.
2.6.3 Results (Circuit 4b)
When you think your circuit and instrumentation is set up correctly get an instructor or TA to verify it before you apply power.
Apply power by using the Main power switch, L1, L2 and L3 should light up to indicate power.
Increase the variac slowly to 75%.
Verify and understand circuit operation using the instruments you set up by going through a few of the balanced (equal number of switches for each phase) R, L and RL load states. Note that if you have no loads turned on you may not read a voltage on the E4 as the star point of the load is floating in the situation.
2.6.3.1 RL Load (4b)
Turn on the Resistive load by switching ON all 9 (3 for each phase) of the switches. Add inductance to the Resistive load by turning on the Inductive load switch 0.8 H for all 3 banks/phases.
In the Results section draw the VAB line-line voltage and the 3 currents I1, I2, and I3 relative the E4 voltage which is given.
Complete the phasor diagram provide in the Results section with the 3 line-line voltages and 3 phase currents relative to the E4 phasor that is given.
Complete the RL Load column from the Metering Instrument in the Results section.
Return the variac to 0%, turn OFF all the load switches and turn-off the main power supply.
Get an instructor or TA to view your results and sign off on your results sheet.
2.7 Clean Up
Verify your results with an instructor or TA to show that you have completed everything.
Cleanup your station, everything should be returned to where you got it from.
Once everything is completed and tidy get a signature on your Results page before you leave.
3 Post-lab
Post-lab are due approximately 1 week after you attend your lab section, check eClass for the exact time. All reports need to be submitted to the appropriate link as a single pdf on eClass. You only have to hand-in one copy per group. Please have your pages in a single pdf file in the following order:
Use the first page of your ECE330 - Lab 1 – Results sheet as your cover sheet. Make sure your names, student ID’s, CCID’s and lab section are visible in the table at the top of the page.
Follow this with the remaining pages of the ‘ECE330 - Lab 1 - Results’ sheet in order. Make sure that you have obtained the required LI or TA signature at the completion of each of the laboratory exercise where required.
The answers to the Post-lab questions.
3.1 Questions
Answer the following questions to hand in with your Post-lab.
Explain what Peak, DC, Average and RMS quantities of a waveform are using an appropriate example.
Explain what is meant when an electrical circuit is described as being either open-circuited or short-circuited. Also describe what is meant when an electrical circuit is described as either being lightly-loaded, loaded or fully-loaded. Use examples to illustrate your point.
The current meter inputs on the Data Acquisition and Control Interface (DACI) have inputs for 2 different ranges of current. What are these ranges, when should each of them be used and why are they necessary?
Typically when making circuit changes to a Power Systems circuit it is best practice to turn-off or all sources of power. Explain in your own words why this is recommended.
For a constant RMS voltage and constant RMS current of the same frequency explain how changing the phase between those two waveforms affects the following power quantities. Use examples of at least 3 different phase angles and the Power Triangle to illustrate your answer.
Real Power
Reactive Power
Apparent Power
Power Factor (PF)
During the lab you were asked to view the help article Technical Information about the Electrical and Mechanical Power Functions . This article explains the different ways that electrical power can be measured using the LVDAC-EMS software. Discuss how the following measurement types can be used to measure three-phase power and their limitations. Include a diagram for each measurement type showing the placement of the appropriate DACI inputs for a three-phase measurement.
PQS1 + PQS2
PQS1 + PQS2 + PQS3
PQS1 (E1,I1) 3~
Compare the following 2 three-phase circuits. Assume that rms voltages Va, Vb, Vc are the same with 120° phase shifts and all of the resistors labeled R have the same resistance. What can be said about the magnitude and phase of the following:
The voltage across each R.
The current through each R.
The current coming from the supply.
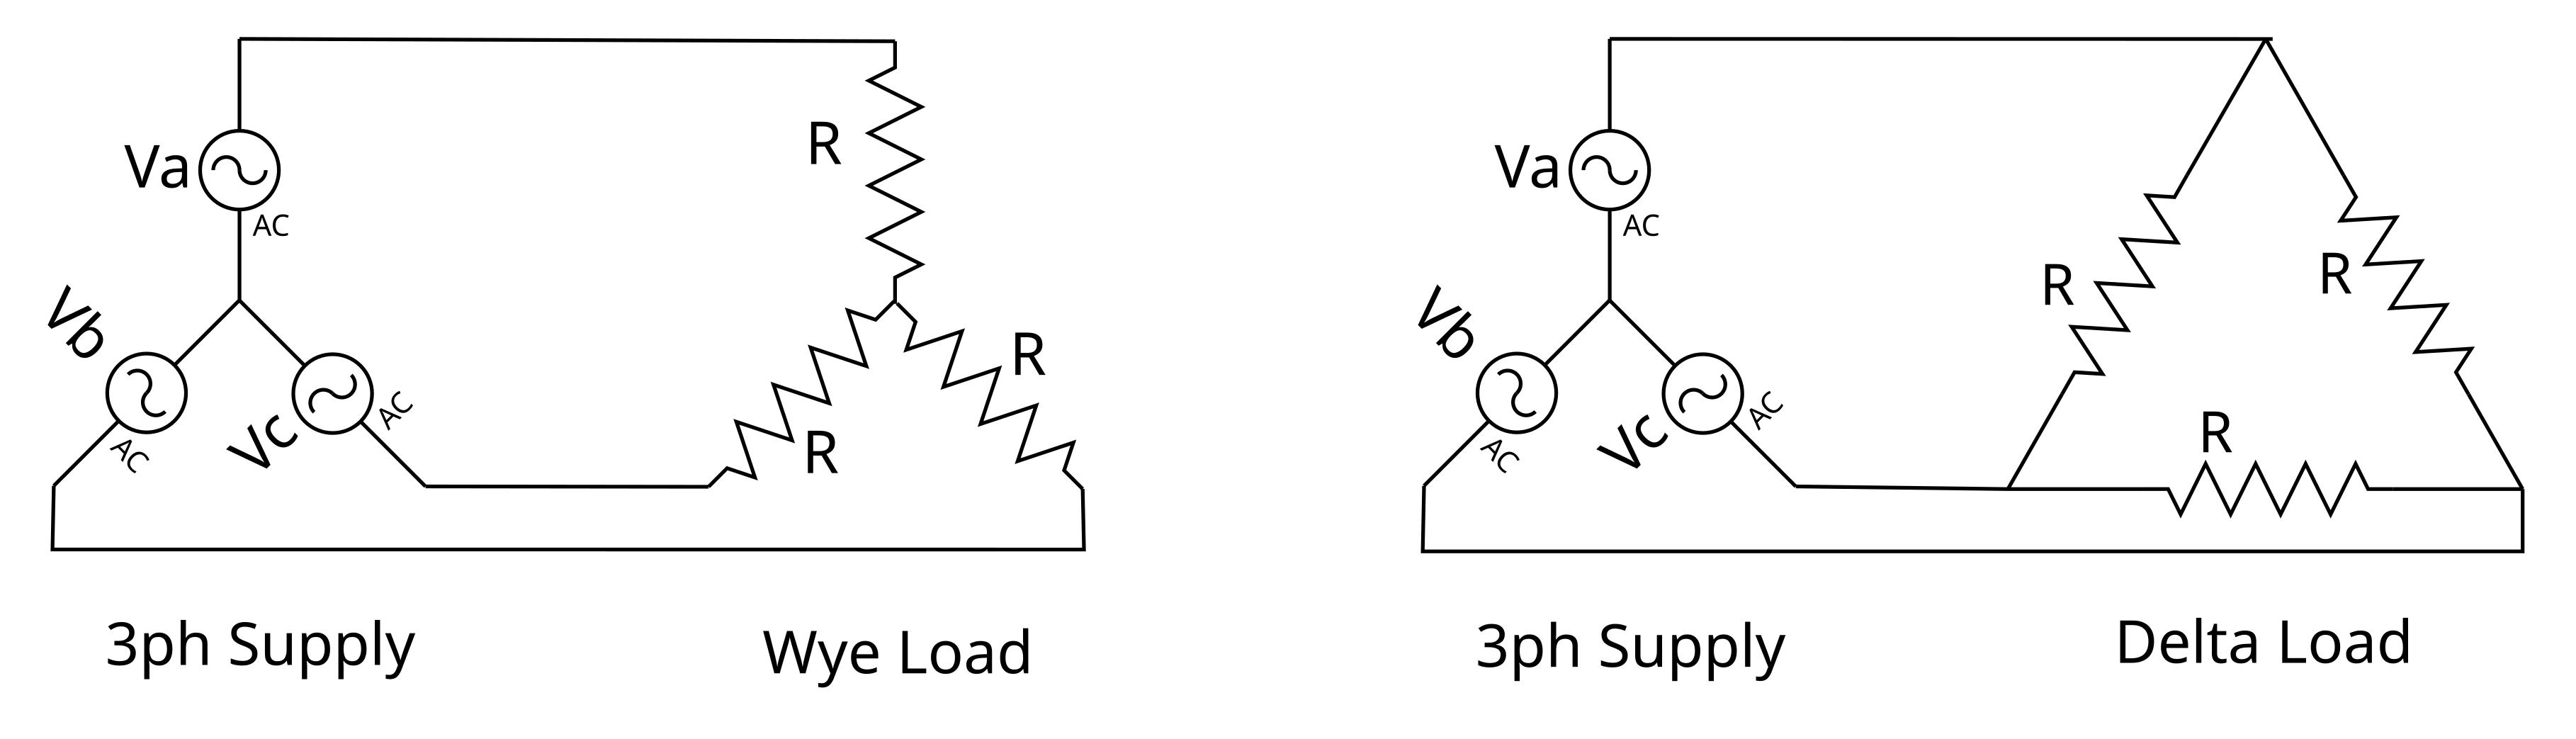
Figure 10. Three-phase resistor circuits compared