Lab 4: Phasors and AC Power
ECE209 - Fundamentals of Electrical Engineering
Electrical and Computer Engineering - University of Alberta
1 Objectives
In this fourth lab session, you will continue to use common electrical tools and components used for AC circuits from your Lab at Home kit and use them to experimentally test and confirm the validity of the AC circuit theory you are taught in the lectures. The objectives are as follows:
Introduce the following devices:
- The Scope - (Cursors)
Introduce the following concepts:
- Phasors
- Active, Reactive and Apparent Power
- Power Factor
- Power Triangle
- RLC series circuit
- RC parallel circuit
1.1 Equipment Required
- The Lab 4 - Results sheet to record your measurements.
- A Computer with Waveforms installed
- Analog Discovery 2
- Breadboard Breakout for the Analog Discovery 2 with a Ribbon Cable
- A USB A to Micro-B cable
- Digital Multimeter
- MB102 breadboard
- Jumper Wires
- The following Resistors (1/4 watt, 1% or 5%)
- two - 10Ω
- 470Ω
- 1.0kΩ
- 2.2kΩ
- 100nF capacitor
- 220nF capacitor
- 10mH inductor
2 Procedures
2.1 Equipment Familiarization
2.1.1 Scope - Measuring Phase
Use the cursors on the scope to measure the relative phase between two signals.
Connect the Analog Discovery 2 to the computer and to your breadboard like you have done in the previous labs.
Open the ‘Waveforms’ program and make sure that it successfully connected to your Analog Discovery 2.
Connect the Wavegen 1 output to the Channel 1 input of the Scope and connect the Wavegen 2 output to the Channel 2 input of the Scope as shown in the circuit below.
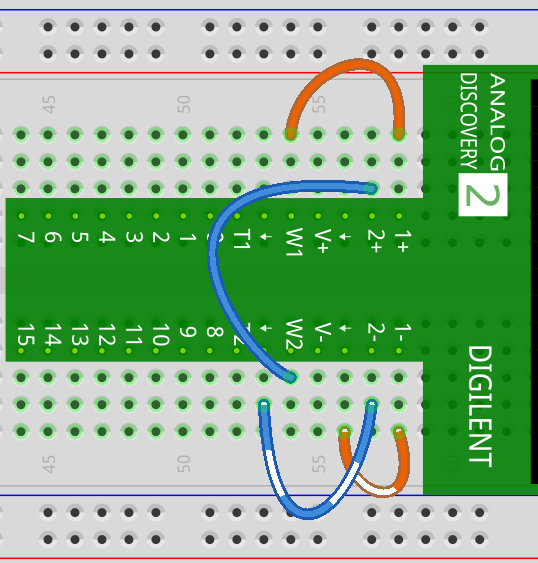
Figure 1: Both Wavegen to Scope channels connected using the breadboard
Using the Wavegen tool create 2 Sine waveforms both at 1kHz and 1VPeak with a phase shift from one another so we can learn how to measure the phase difference between those waveforms on the Scope.
- To do this, first make sure both channels (W1, W2) are displayed by using the Channels dropdown box as shown below.
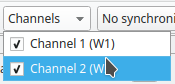
Figure 2: Wavegen channels dropdown
- Double check that both channels (W1, W2) are currently configured like the following:
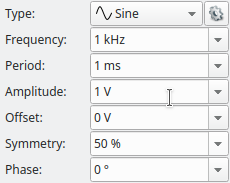
Figure 3: Wavegen channel output controls
Use the Channel 2 (W2) controls to change the Phase to 90°.
In the top toolbar in the dropdown to the right of the Channels dropdown you also need to select ‘Synchronized’ as shown below. This ensures that the phase between Channels 1 and 2 will output correctly.
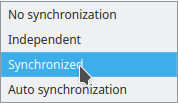
Figure 4: Wavegen synchronize channels
- Click on the ‘Run All’ Button on the top toolbar to output the signals on the W1 and W2 pins on the Analog Discovery 2. Your Waveforms screen should now look like the following.
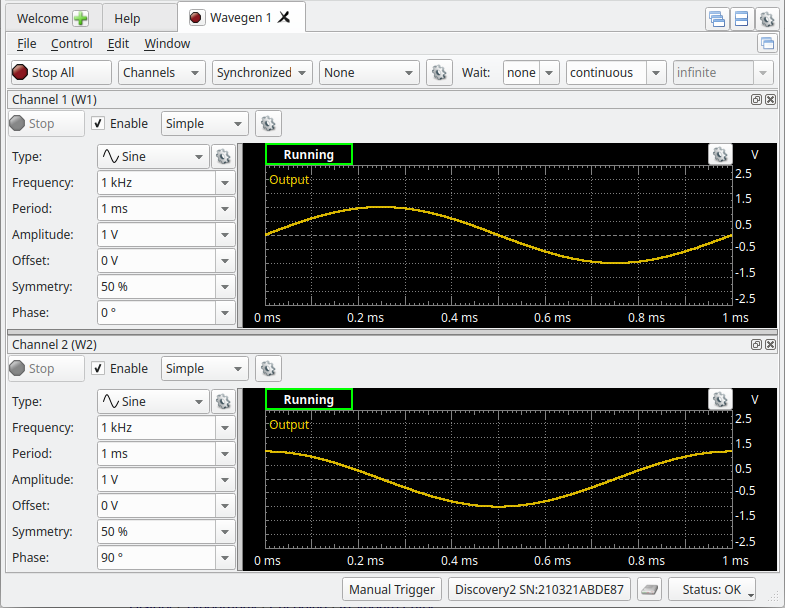
Figure 5: Both Wavegen channels running with 90° phase shift
With the Wavegen now running also open up the Scope tool in Waveforms and click on the ‘Run’ button. You should be able to see the 2 Wavegen outputs being measured on the Scopes display. Adjust the appropriate controls until you obtain a display like the one shown below.
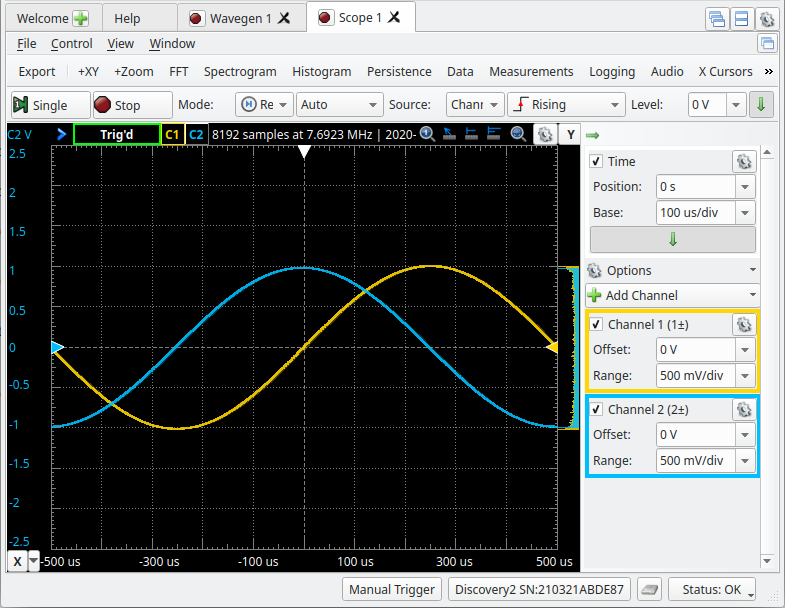
Figure 6: Scope measuring the Wavegen channel outputs
As you can see above the blue waveform is “leading” the yellow waveform or the yellow is “lagging” the blue. To measure the phase difference between these 2 waveforms in time we can easily approximate this by counting the horizontal divisions from where the yellow crosses the 0V level to where the blue cross the 0V level. This is about 2.5 divisions and with a Base of 100us/div that works out to 250us. Knowing that the frequency of this waveform is 1kHz, the period is 1000us. So, to solve for the phase difference in degrees you simply need to take the measured 250us and divide by the period and then multiply by 360°. When doing this you notice that we get 90°, which is the same as the angle we put in to the Channel 2 Wavegen signal.
As the number of divisions don’t always work out so nicely as the example, you can either use the X Cursors tool located in the top toolbar or the Quick Measure tool I’m going to show here to make a quicker more accurate measurement. To activate the tool simple double click anywhere on the Scopes waveform display and your cursor will become a vertical red bar you can move around the display like the one shown below.
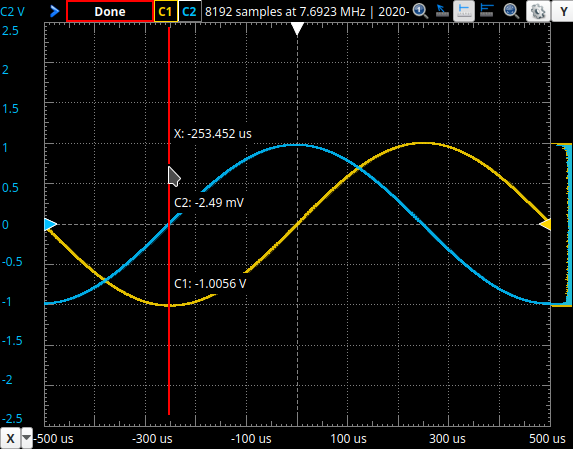
Figure 7: X-cursor quick measure tool
When you move the red cursor left and right on the display it will tell you the instantaneous voltage of both channels at the specific time that you have the cursor. First, find the closest time when the blue waveform (Ch2) is closest to 0V and click the mouse button. Second, move the cursor to the closest time when the yellow waveform (Ch1) is closest to 0V and click the mouse button again. Your display should now look similar to the one below.
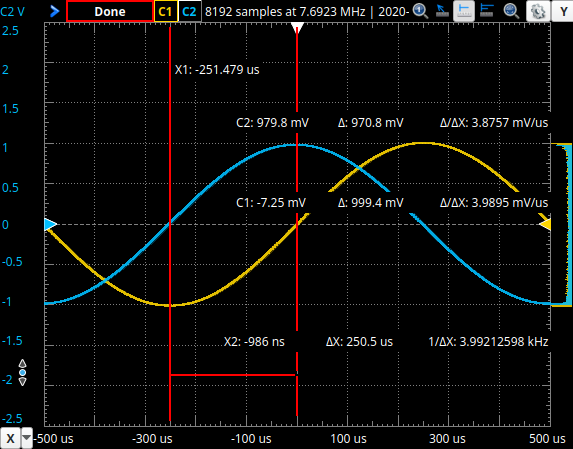
Figure 8: Scope measuring time for phase shift calculation
There is now a lot of information on the screen but the value that we are interested in is the ΔX. Which is the time between the 2 red cursors. On the display above this time is measured at 250.5us. Which closely matches what we measured when we simply counted the divisions. Below is the equation which turns this measured time into a phase value.
\[\phi = -(\frac{t_{Phase}}{period}) \times 360^{\circ}\]
Note:
When measuring the phase in time between two waveforms it is important to measure the time starting with the reference waveform to the waveform under test to obtain the correct sign. So, if the reference waveform is to the right of the waveform under test, the waveform under test is said to be “leading” and the sign of the time measurement will be negative. If the waveform under test is “lagging” the sign of the time measurement will then be positive. Recall that shifting left in time corresponds to a positive phase shift and shifting right to a negative. This effect is the opposite to the measurement. Therefore when converting from a phase in time to a phase in angle the sign needs to be switched. This is why there is a negative sign in the formula above.Note:
In a circuit it is convention to use the current relative to the voltage to decide if the circuit is leading or lagging. Therefore a circuit is lagging if the current lags the voltage and leading if the current leads the voltage.
2.2 Individual Components
2.2.1 Resistor
Use the circuit below to measure both the voltage across and the current through the 1kΩ resistor on the Scope to see the phase relationship between the two. Also use the Scope to calculate the instantaneous power through the resistor so the power waveform can also be demonstrated.

Circuit 1: AC resistor circuit
Click here to see a simulation demo of this circuit.Connect the circuit above using the following:
Use the breadboard to connect a 1kΩ resistor, which is the device under test, in series with a 10Ω resistor, which is used as a current sense resistor.
Note:
A current sense resistor is a small resistor intentionally inserted in a circuit so the voltage can be measured across it to determine the current by simply dividing the measured voltage by the resistors resistance. In this circuit adding the 10Ω resistor will only have a very small effect (~1%) on how the circuit would operate without it but is added to determine the current waveform.Use the Wavegen (W1) as an ac voltage source to supply a 5VPEAK sinewave at 5kHz across the resistors.
Use the 2 Scope channels of the Analog Discovery 2: Ch1 (1+, 1-) to measure the voltage across R1 and Ch2 (2+,2-) to measure the voltage across R_sense.
Note:
When connecting the signals to the Scope inputs make sure that the polarity matches the signs indicated on the components in the schematic.
Run the Wavegen tool in Waveforms to enable the ac voltage source and use the Scope tool to display the voltage across each resistor at an appropriate scale (both Volts/div and Sec/div).
For the current sense resistor voltage measured on channel 2 create a new channel by clicking on (Add Channel/Custom) and adding the appropriate math to calculate the current waveform (C2/10). Adjust the scale for the new current waveform displayed on the Scope. You can use the checkbox on Channel 2 to hide it as we are just using it as an intermediate signal to obtain the current.
To obtain the instantaneous power waveform for the resistor under test (1kΩ) we will multiply the voltage waveform on Channel 1 by the current waveform on the new channel you created above (Math 1). Create this new channel by clicking on (Add Channel/Simple) and making the first term Channel 1 (C1), the operator multiply (X) and the second term Math 1 (M1) as shown below. Adjust the scale for the new power waveform displayed on the Scope so you can see the a few cycles of the waveform.
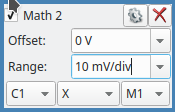
Figure 9: New scope channel - calculate the instantaneous power waveform
Use the ‘Measurements’ tool in the Scope toolbar to add an automatic measurement for both the period and the RMS voltage for Channel 1, the RMS current for your current channel (Math 1) and the average, maximum and minimum powers for your power channel (Math 2). Record the measurements in the appropriate place in the results sheet.
Use the Scope - Measuring Phase procedure from the equipment familiarization to determine the phase difference between the current through I and the voltage across V (ref) the 1kΩ resistor expressed in time.
Note:
The phase difference between the voltage across and current through a resistor is theoretically zero. Therefore the measured time between the 2 waveforms should also be approximately zero. This will not be the case when you measure the phase difference between the voltage across and the current through a capacitor or an inductor.After you obtain all of the required measurements for the resistor turn off the ac voltage source before you modify your circuit for the next section.
2.2.2 Capacitor
Use the circuit below to measure both the voltage across and the current through the 100nF capacitor on the Scope to see the phase relationship between the two. Also use the Scope to calculate the instantaneous power through the capacitor so the power waveform can also be demonstrated.

Circuit 2: AC capacitor circuit
Click here to see a simulation demo of this circuit.Modify the circuit from the previous section by replacing the device under test, the 1kΩ (R1) resistor, with a 100nF (C1) capacitor.
Adjust the frequency of the Wavegen to 1.592kHz so the reactance of the 100nF capacitor approximately equals 1kΩ. This matches the resistance of the resistor used in the last part.
Use a similar procedure as you used for the resistor in the previous section to obtain the measurements for the capacitor. Make sure to record all of your measurements in the appropriate place on the results sheet.
After you obtain all of the required measurements for the capacitor turn off the ac voltage source before you modify your circuit for the next section.
2.2.3 Inductor
Use the circuit below to measure both the voltage across and the current through the 10mH inductor on the Scope to see the phase relationship between the two. Also use the Scope to calculate the instantaneous power through the inductor so the power waveform can also be demonstrated.

Circuit 3: AC inductor circuit
Click here to see a simulation demo of this circuit.Modify the circuit from the previous section by replacing the device under test, a 100nF (C1) capacitor, with a 10mH (L1) inductor.
Adjust the frequency of the Wavegen to 15.92kHz so the reactance of the 10mH inductor approximately equals 1kΩ. This matches the resistance and reactance of the resistor and capacitor in the previous sections.
Use a similar procedure as you used for the components in the previous sections to obtain the measurements for the inductor. Make sure to record all of your measurements in the appropriate place on the results sheet.
After you obtain all of the required measurements for the inductor turn off the ac voltage source and disconnect the circuit as you won’t need it in the next section.
2.3 Series RLC
Investigate the effect frequency has on a series resistor-inductor-capacitor circuit. Use phasors and the power triangle as tools to demonstrate the effect.
.svg)
Circuit 4: Series RLC circuit (setup 1)
Click here to see a simulation demo of this circuit.Connect setup 1 of the circuit above using the following:
Use the breadboard to connect a RLC series circuit with a 100nF capacitor, 10mH inductor and a 470Ω resistor.
Use the Wavegen (W1) as an ac voltage source to supply a 4.243VPEAK sinewave at 2.5kHz across the RLC series circuit.
Use the 2 Scope channels of the Analog Discovery 2: Ch1 (1+, 1-) to measure the voltage across R1 and Ch2 (2+,2-) to measure the voltage across Vs.
Note:
When connecting the signals to the Scope inputs make sure that the polarity matches the signs indicated on the components in the schematic.
Run the Wavegen tool in Waveforms to enable the ac voltage source and use the Scope tool to display the voltage across the R1 resistor and the Vs source at an appropriate scale (both Volts/div and Sec/div). Use the ‘Measurements’ tool in the Scope toolbar to add an automatic measurement for both the period and the RMS voltages for Channel 1 and 2. Record the measurements in the appropriate place in the results sheet.
For the R1 resistor voltage measured on channel 1 create a new channel by clicking on (Add Channel/Custom) and adding the appropriate math to calculate the circuits current waveform (C1/470). Adjust the scale appropriately for the new current waveform displayed on the Scope. Use the ‘Measurements’ tool in the Scope toolbar to add an automatic measurement for the RMS current for this new waveform (Math 1). Record the measurement in the appropriate place in the results sheet.
To obtain the instantaneous power waveform for the entire circuit we will multiply the ac source voltage waveform on Channel 2 by the source current waveform on the new channel you created above (Math 1). Create this new channel by clicking on (Add Channel/Simple) and making the first term Channel 2 (C2), the operator multiply (X) and the second term Math 1 (M1). Adjust the scale for the new power waveform (Math 2) displayed on the Scope so you can see the a few cycles of the waveform. Use the ‘Measurements’ tool in the Scope toolbar to add an automatic measurement for the average, maximum and minimum values of this new instantaneous power waveform. Record the measurements in the appropriate place in the results sheet.
Use the Scope - Measuring Phase procedure from the equipment familiarization to determine the phase difference between the voltages VS and VR (ref) expressed in time. Record your measurement on the results sheet.
Note:
All phase measurements for this circuit will be made with respect to the the resistor voltage (VR) which, of course, is in phase with the resistor current (IR).Adjust the frequency of the ac voltage source first to 5kHz and then to 10kHz and 20kHz while repeating all of the same measurements as above until you finish the setup 1 portion of the table on the results sheet.
.svg)
Figure 10: Series RLC circuit (setup 2)
Reset the frequency of the ac voltage source to 2.5kHz and move the channel 2 Scope inputs to measure the voltage across the capacitor as shown in the circuit above. Make sure you connect the probes in the same polarity as indicated on the setup 2 schematic above.
Use the automatic ‘Measurements’ to measure and record the RMS voltage across the capacitor.
Use the Scope - Measuring Phase procedure from the equipment familiarization to determine the phase difference between the voltages VC and VR (ref) expressed in time. Record your measurement on the results sheet.
Adjust the frequency of the ac voltage source first to 5kHz and then to 10kHz and 20kHz while repeating all of the same measurements as above until you finish the setup 2 portion of the table on the results sheet.
.svg)
Figure 11: Series RLC circuit (setup 3)
Reset the frequency of the ac voltage source to 2.5kHz and move the channel 2 Scope inputs to measure the voltage across the inductor as shown in the circuit above. Make sure you connect the probes in the same polarity as indicated on the setup 3 schematic above.
Use the automatic ‘Measurements’ to measure and record the RMS voltage across the inductor.
Use the Scope - Measuring Phase procedure from the equipment familiarization to determine the phase difference between the voltages VL and VR (ref) expressed in time. Record your measurement on the results sheet.
Adjust the frequency of the ac voltage source first to 5kHz and then to 10kHz and 20kHz while repeating all of the same measurements as above until you finish the setup 3 portion of the table on the results sheet.
After you obtain all of the required measurements for this circuit turn off the ac voltage source and disconnect the circuit as you won’t need it in the next section.
2.4 Parallel RC
Investigate the effect frequency has on a parallel resistor-capacitor circuit. Use phasors and the power triangle as tools to demonstrate the effect.
.svg)
Circuit 5: Parallel RC circuit (setup 1)
Click here to see a simulation demo of this circuit.Connect setup 1 of the circuit above using the following:
Use the breadboard to connect a RC parallel circuit with a 2.2kΩ resistor (R1) and a 220nF capacitor (C1). You also need to use two 10Ω sense resistors (R_sense1 and R_sense2) so you will be able to determine the source current waveform and the capacitor current waveform.
Use the Wavegen (W1) as an ac voltage source to supply a 4.243VPEAK sinewave at 250 Hz across the RC parallel circuit.
Use the 2 Scope channels of the Analog Discovery 2: Ch1 (1+, 1-) to measure the voltage across R1 and Ch2 (2+,2-) to measure the voltage across R_sense1 which will be used to determine the source current.
Note:
When connecting the signals to the Scope inputs make sure that the polarity matches the signs indicated on the components in the schematic.
Run the Wavegen tool in Waveforms to enable the ac voltage source and use the Scope tool to display the voltage across both the R1 and R_sense1 resistors at an appropriate scale (both Volts/div and Sec/div). Use the ‘Measurements’ tool in the Scope toolbar to add an automatic measurement for both the period and the RMS voltage for Channel 1. Record the measurements in the appropriate place in the results sheet.
For the R1 resistor voltage measured on channel 1 create a new channel by clicking on (Add Channel/Custom) and adding the appropriate math (C1/2200) to calculate the resistor current waveform (IR). Adjust the scale appropriately for the new current waveform displayed on the Scope. Use the ‘Measurements’ tool in the Scope toolbar to add an automatic measurement for the RMS current for this new waveform (Math 1). Record the measurement in the appropriate place in the results sheet.
For the R_sense1 resistor voltage measured on channel 2 create a new channel by clicking on (Add Channel/Custom) and adding the appropriate math (C2/10) to calculate the source current waveform (IS). Adjust the scale appropriately for the new current waveform displayed on the Scope. You can use the checkbox on Channel 2 to hide it as we are just using it as an intermediate signal to obtain the current. Use the ‘Measurements’ tool in the Scope toolbar to add an automatic measurement for the RMS current for this new waveform (Math 2). Record the measurement in the appropriate place in the results sheet.
To obtain the instantaneous power waveform for the entire circuit we will multiply the ac source voltage waveform on Channel 1 by the source current waveform on the new channel you created above (Math 2). Create this new channel by clicking on (Add Channel/Simple) and making the first term Channel 1 (C1), the operator multiply (X) and the second term Math 2 (M2). Adjust the scale for the new power waveform (Math 3) displayed on the Scope so you can see the a few cycles of the waveform. Use the ‘Measurements’ tool in the Scope toolbar to add an automatic measurement for the average, maximum and minimum values of this new instantaneous power waveform. Record the measurements in the appropriate place in the results sheet.
Use the Scope - Measuring Phase procedure from the equipment familiarization to determine the phase difference between the current IS and the voltage VR (ref) expressed in time. Record your measurement on the results sheet.
Note:
All phase measurements for this circuit will be made with respect to the the resistor voltage (VR) which, if the current sense resistors have negligible effect on the circuit, is in phase with the source voltage (VS) and the capacitor voltage (VC).Adjust the frequency of the ac voltage source first to 500 Hz and then to 1kHz while repeating all of the same measurements as above until you finish the setup 1 portion of the table on the results sheet.
.svg)
Figure 12: Parallel RC circuit (setup 2)
Reset the frequency of the ac voltage source to 250 Hz and move the channel 2 Scope inputs to measure the voltage across the resistor R_sense2 as shown in the schematic above. Make sure you connect the probes in the same polarity as indicated.
You can use the checkbox on all channels to hide them except on Channel 1 which is still displaying VR and Math 2 which will now be showing the capacitor current IC. Use the automatic ‘Measurements’ to measure and record the RMS current though the capacitor.
Use the Scope - Measuring Phase procedure from the equipment familiarization to determine the phase difference between the capacitor current (IC) and the resistor voltage VR (ref) expressed in time. Record your measurement on the results sheet.
Adjust the frequency of the ac voltage source first to 500 Hz and then to 1kHz while repeating all of the same measurements as above until you finish the setup 2 portion of the table on the results sheet.
After you obtain all of the required measurements for this circuit turn off the ac voltage source and disconnect the circuit.
2.5 Cleanup
Congratulations, you have completed the experimental part of the the laboratory. Before cleaning up, I’d suggest going through your results to check that you have completed everything and that your results make sense. If you find any issues, I’d suggest resolving or making a note of it now. If you are not continuing to work with the equipment please disconnect everything and put it away to prevent it from getting damaged.
3 Results
The following is what you are expected to complete and submit for grading for Lab 4 before the deadline:
The completed Lab 4 - Results sheet template provided at the beginning of this lab manual under Equipment required. This sheet should include the following:
- Your name, student ID and CCID.
- All of the required measurements from the lab procedures.
- All of the required calculations as discussed below.
- The required plots as discussed below.
The Lab 4 - Results sheet needs to be submitted to the Submit (Lab 4 - Results) link on eClass as a pdf document .
- Complete the online Quiz (Lab 4 - Post Lab) on eClass.
3.1 Calculations
For these calculation you only need to provide the answers in the space provided on your results sheet, you do not need to show your work.
Section 2.2 - Individual Components - Calculate the following from your results to complete the table on your results sheet.
ɸI - The current angle in degrees relative to the voltage across the component.
I (lead/lag) V - Indicate weather the current through the component is leading or lagging the components voltage.
Z - The absolute magnitude of the impedance of the component in ohms.
P - The power dissipated by the component in milliwatts.
Q - The reactive power of the component in millivolt-ampere reactive.
S - The apparent power of the component in millivolt-ampere.
PF - The power factor of the component.
Section 2.3 - Series RLC - Calculate the following from your results to complete the table on your results sheet.
ɸVS - The supply voltage angle in degrees relative to the supply current or resistor voltage which is used as the reference.
ɸVC - The capacitor voltage angle in degrees relative to the supply current or resistor voltage which is used as the reference.
ɸVL - The indcutor voltage angle in degrees relative to the supply current or resistor voltage which is used as the reference.
Z - The absolute magnitude of the effective impedance of the circuit in ohms.
P - The power dissipated by the circuit in milliwatts.
Q - The reactive power of the circuit in millivolt-ampere reactive.
S - The apparent power of the circuit in millivolt-ampere.
PF - The power factor of the circuit.
IS (lead/lag) VS - Indicate weather the supply current is leading or lagging the supply voltage.
Section 2.4 - Parallel RC - Calculate the following from your results to complete the table on your results sheet.
θIS - The supply current angle in degrees relative to the resistor voltage or supply voltage which is used as the reference.
θIC - The capacitor current angle in degrees relative to the resistor voltage or supply voltage which is used as the reference.
Z - The absolute magnitude of the effective impedance of the circuit in ohms.
P - The power dissipated by the circuit in milliwatts.
Q - The reactive power of the circuit in millivolt-ampere reactive.
S - The apparent power of the circuit in millivolt-ampere.
PF - The power factor of the circuit.
IS (lead/lag) VS - Indicate weather the supply current is leading or lagging the supply voltage.
3.2 Plots
To create your plots you can use whichever software you would like (Excel, Matlab, etc), export your plot as an image and import it into your Lab 4 - Results sheet in the appropriate place.
Your plots should include:
- A Plot title
- Label your axes and show what unit of measure is used.
- Include a marking for your data points.
- Include a line between your data points in the same series.
- Include a legend.
- Make sure your scales are appropriate and visible.
Individual Components - Phasor Diagram - Create a phasor diagram for the voltage and current for each individual component that you measured in section 2.2. (3 total). Don’t worry about the scales of the phasors just make sure to label the voltage, current and angle with their magnitudes.
Series RLC Circuit - Phasor Diagram - Create a phasor diagram for the series RLC circuit that you measured in section 2.3. Include the following signals: VR(ref), VS, VL, VC and IS. Use VR as you reference signal (0°). You need to make 1 phasor diagram for each frequency (4 total).
Series RLC Circuit - Power Triangle - Create a power triangle plot for the series RLC circuit that you measured in section 2.3. Include the following signals: P, Q and S. You need to make 1 power triangle plot for each frequency (4 total).
Parallel RC Circuit - Phasor Diagram - Create a phasor diagram for the parallel RC circuit that you measured in section 2.4. Include the following signals: VS(ref), IS, IR, and IC. Use VS as you reference signal (0°). You need to make 1 phasor diagram for each frequency (3 total).
Parallel RC Circuit - Power Triangle - Create a power triangle plot for the parallel RC circuit that you measured in section 2.4. Include the following signals: P, Q and S. You need to make 1 power triangle plot for each frequency (3 total).
3.3 Questions
Complete the online Quiz (Lab 4 - Post Lab) on eClass.